Income Mobility in the US
todo Kweon and possibly Frequently Asked Questions (FAQs)
Genes
Your ability to earn money is almost entirely determined by your genes, with some room for personal prioritization and raw luck. While shared environment is responsible for ~0% of income variance, this isn't as airtight of an argument against environmental factors as it first appears.
For instance, suppose just 5% of the variance is determined by shared environment, then a 1 SD increase in shared environment would causes a 0.22 SD increase in earnings, which is roughly a 17% gain. This is basically because the correlation is the square root of explained variance. Moreover, some factors (like race and sex) could plausibly explain large differences in income (like ~30%) but still statistically explain a tiny portion of income variance ( e.g. 1%).
For these reason, although genes play a very large role in determining ability and earnings, the importance of specific environmental factors isn't ruled out a priori. They are, however, implied to be limited.
Intelligence
Intelligence is a controversial topic. However, its significantly less controversial among experts than laypeople and many laypeople, even "pro science" lay people often are surprised by what
One particular outcome is that IQ (or g factor) correlates with is income - the correlation coefficient has been estimated at
However, there are a couple of problems with these reviews. I've discussed many of these elsewhere, but one additional problem is that these studies use different control variables (or none at all), which makes aggregating them in a meta-analysis dubious. Two meta-analysis
However, I took a look at the study cited by Jensen. It had nearly 29,000 people and some odd things show up when we look at the details of the two meta-analyses above as they relate to this study.
The first meta-analysis didn't include this study at all for reasons I can't discern.
The second study did include it, but gave it less weight:
Because the sample sizes were highly variable (from 60 to 339,951 with a median of 518), weighting the correlations by sample size would allow the few very large studies to overly dominate the results. To prevent that, all the samples with the size over 7000 individuals (about 5% of the samples in this study) were set equal to 7000 for the weighting procedure.
Moreover, the second study used the correlation found in the overall sample rather than at the highest age. This isn't a "mistake" per-se, but since the correlation between IQ scores and income increase with age, it is a decision that affects the results. If the authors hadn't made these choices, the meta-estimated would likely have been about 0.27.
My guess is that after accounting for all these issues, the intelligence-income-lifetime correlation is probably around ~0.42 and the intelligence-ability correlation is around ~0.47.
For just a moment, suppose we interpret these correlational estimates as causal. This would mean IQ is responsible for about 18% (22%) of the variance in income (ability). Since IQ positively correlates with lots of other things that presumably cause higher earnings, this provides an upper bound on the causal effect. Note that intelligence is practically entirely genetic in adulthood, which suggests (1) that IQ is likely one of the major vectors through which genes influence income but (2) that this avenue still only accounts for a minority of genes' influence.
Financial Resources
The most "obvious" vector through which shared environment affects income is via money - if your parents have money, they can spend that to give you more opportunities.
The only problem with this theory is the evidence, which is mixed at best in the developed world
Evidence Against:
- The Georgia land lottery winners won the equivalent of 5 years of unskilled labor (think ~$100k today). Not only does Shocking behavior: Random wealth in antebellum Georgia and human capital across generations fail to reject the null hypothesis, it does so with significant power, suggesting it is unlikely that this huge wealth transfer caused eventual child wealth to be more than a few percent higher. See also Up from Poverty? and Poulos for further analysis of the long-term effects of the Georgia land lottery.
- The children of Swedish lottery winners had no improvements in drug consumption, scholastic performance, or skills Lindqvist. Like with the Georgia studies, this study has a large sample size and is, so, quite powerful, allowing us to reject all but modest effects of wealth.
- An adoption study found ~0 association between parental income and eventual child income How large are the effects from changes in family environment? A study of Korean American adoptees.
Also, kind of tangential, but you have to wonder how important income inequality is at perpetuating itself given that pre-tax income inequality is just as bad in Western Europe as in the US Gini in the bottle despite a huge difference in welfare spending.
Evidence in Favor:
- Mothers' Pension recipients in the early 1900s got cash transfer that "generally represented 12-25% of family income, and typically lasted for three years." The children of these recipients earned ~14% more than the children of reject applicants in early adulthood and saw other educational and health benefits Aizer.
- A quasi-experiment using Medicaid eligibility as a treatment finds no effect of it on adulthood income for males. For females, a year of additional Medicaid eligibility increased cumulative earnings by 1.3% by the age of 28 The Long-Term Impact of Medicaid Expansions on Eligible Children.
- Children raised in families that receive housing vouchers or public housing earned several percent more than other children depending on program/sex Andersson.
- Using EITC variation as a a treatment, a study found that an additional $1000 per year from age 13 to 17 caused an increase in annual earnings by ~2.2% Bastian.
- An adoption study found r~0.1 association between father income and eventual child income Björklund.
As you can see, the evidence is mixed,
I made a spreadsheet computing fixed-effects meta estimate for this implied elasticity based on the non-adoption favorable studies. The result? An estimated elasticity of 4.0 with SE=0.5.
This brings us to a weird issue: an elasticity of between 3.0 and 5.0 is several times higher than the theoretical maximum (1.0, where everyone's income is purely determined by their parents' incomes) and an order of magnitude higher than any reasonable estimate consistent with the twin studies referenced in the "Genes" section above. This makes me very suspicious of these studies' results.
There is a way to reconcile these contradictory pieces of evidence: one-time cash transfers are useless; income transfers are useless to most families; income transfers are very important to very poor families - to the extent that a 1% boost now will boost child incomes by more than 1% in adulthood.
I think this hypothesis and the null hypothesis (that effect are ~0) are only two reasonable ones to believe given the evidence.
Finally, I should mention that there exist studies that find cash transfers boost students' educational achievements. It's unclear, however, how much these boosts lead to higher earnings later in life. Moreover, there is a significant replication crisis in the nearby study of the impact of poverty on cognitive ability, which makes me weary of this entire field of research O’Donnell.
Neighbors
One of the most important studies in income mobility was done by Chetty et al using millions of tax returns The opportunity atlas: Mapping the childhood roots of social mobility.
Essentially, the authors create a model that predicts a child's income based on their neighborhood, race, gender, and parental income.
The study itself is purely observational, but the authors provide significant evidence that the observed estimates for each neighborhood are probably largely causal,
Across all CZs, the average population-weighted “price of opportunity” is 0.194 – that is, a $1,000 increase in future annual income for children costs an additional $190 in annual rent for each year of their childhood. However, the standard deviation of these estimates across CZs is 0.121, showing that there is considerable dispersion in the price of opportunity
If we assume a 5% discount rate, this suggests you can "buy" $1 for each of your N children for just 39/n ¢ today.
So, practically speaking, what predicts a good neighborhood?
On a low level, you can just see the "Opportunity Atlas", which uses the data from this study to build heat map revealing which neighborhoods are the best The Opportunity Atlas.
On a higher level, Chetty et al actually provide the data used in the paper Data Library: Publicly available data we've produced and replication code (not individual tax returns, but averages across race, gender, and neighborhood).
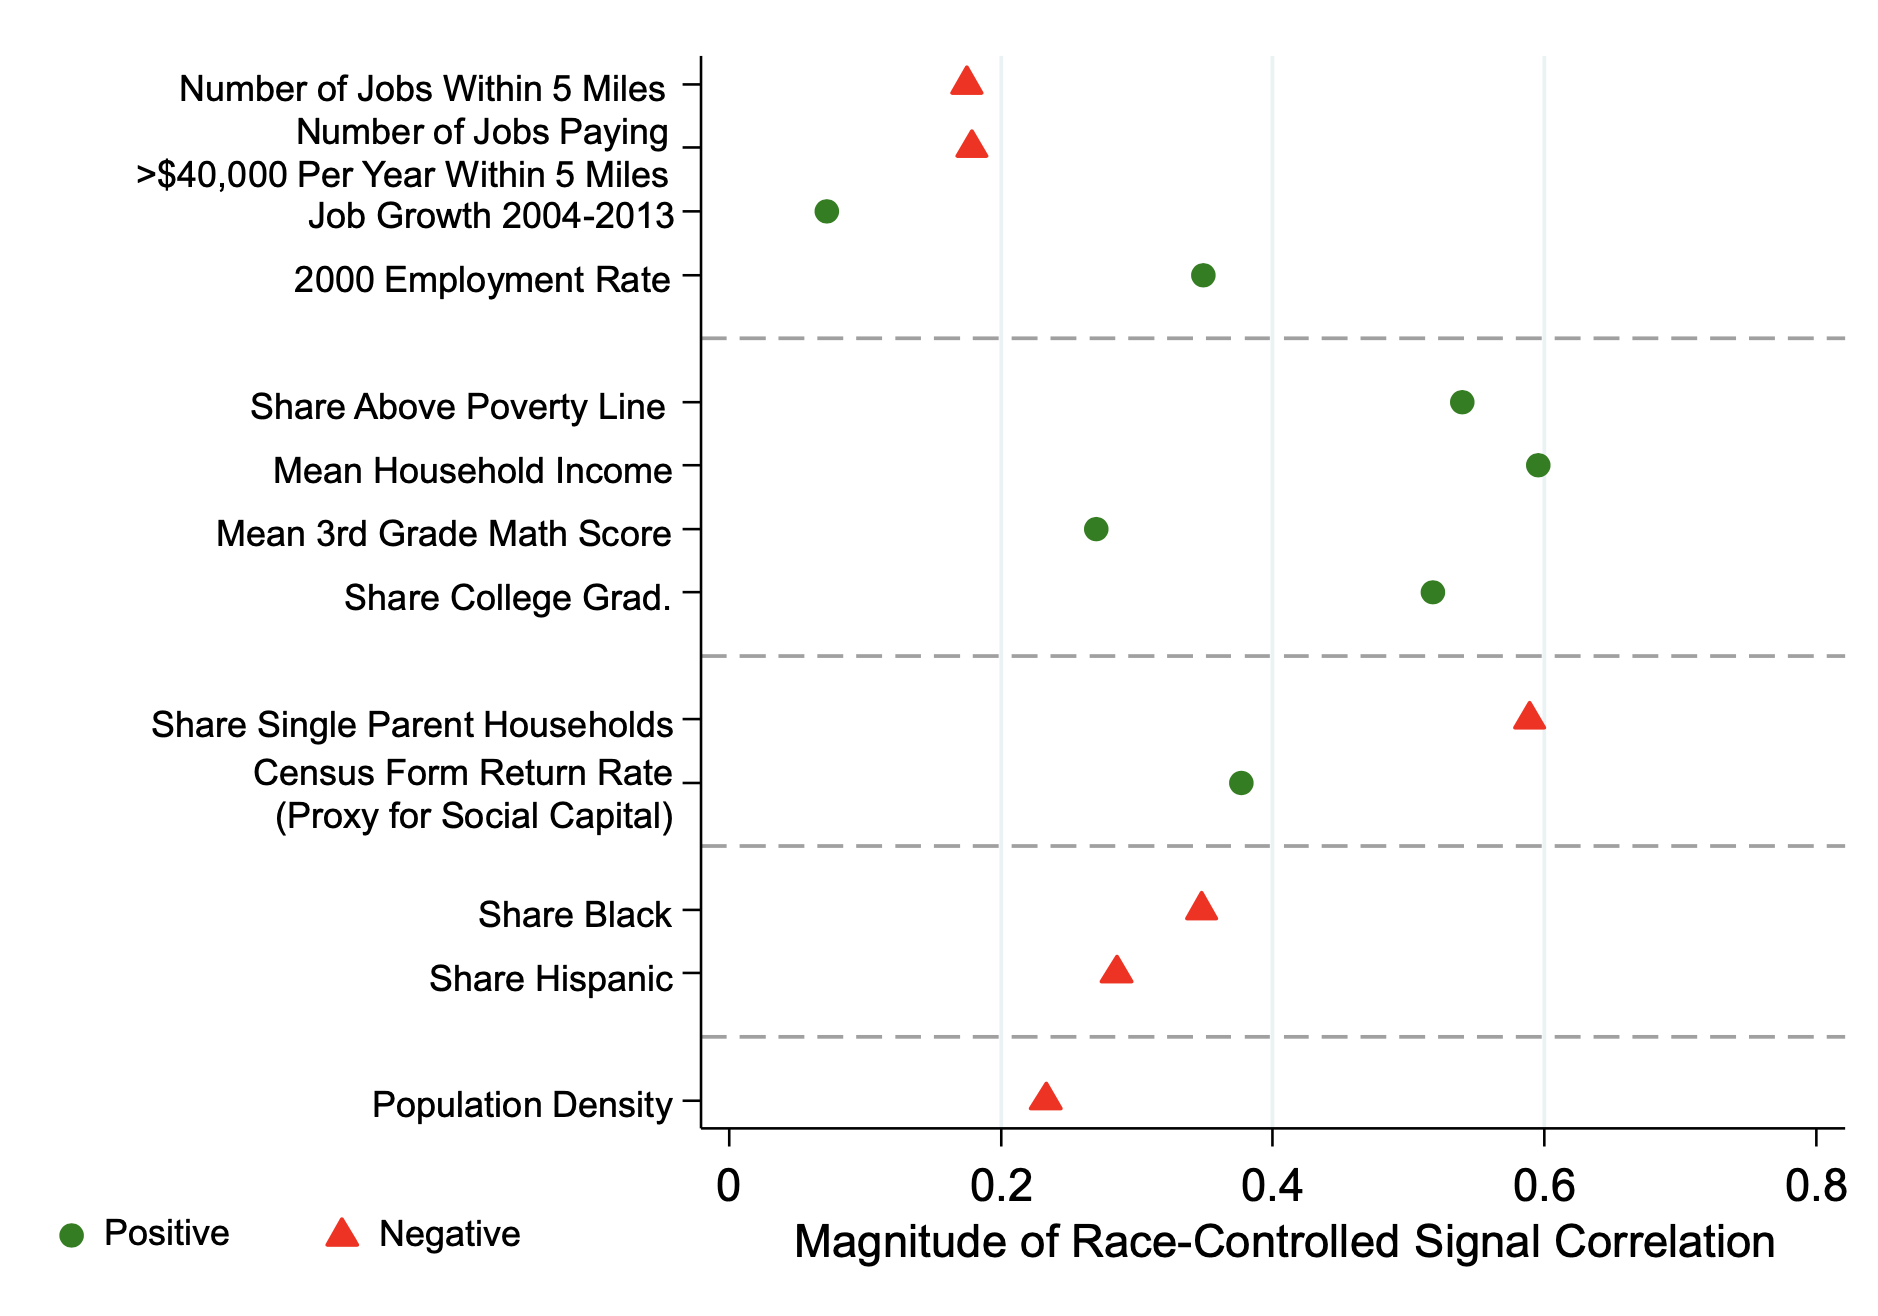
Finally and most abstractly, Chetty et al provide their own conclusions in the paper itself, which is probably best summarized by Figure VIII:
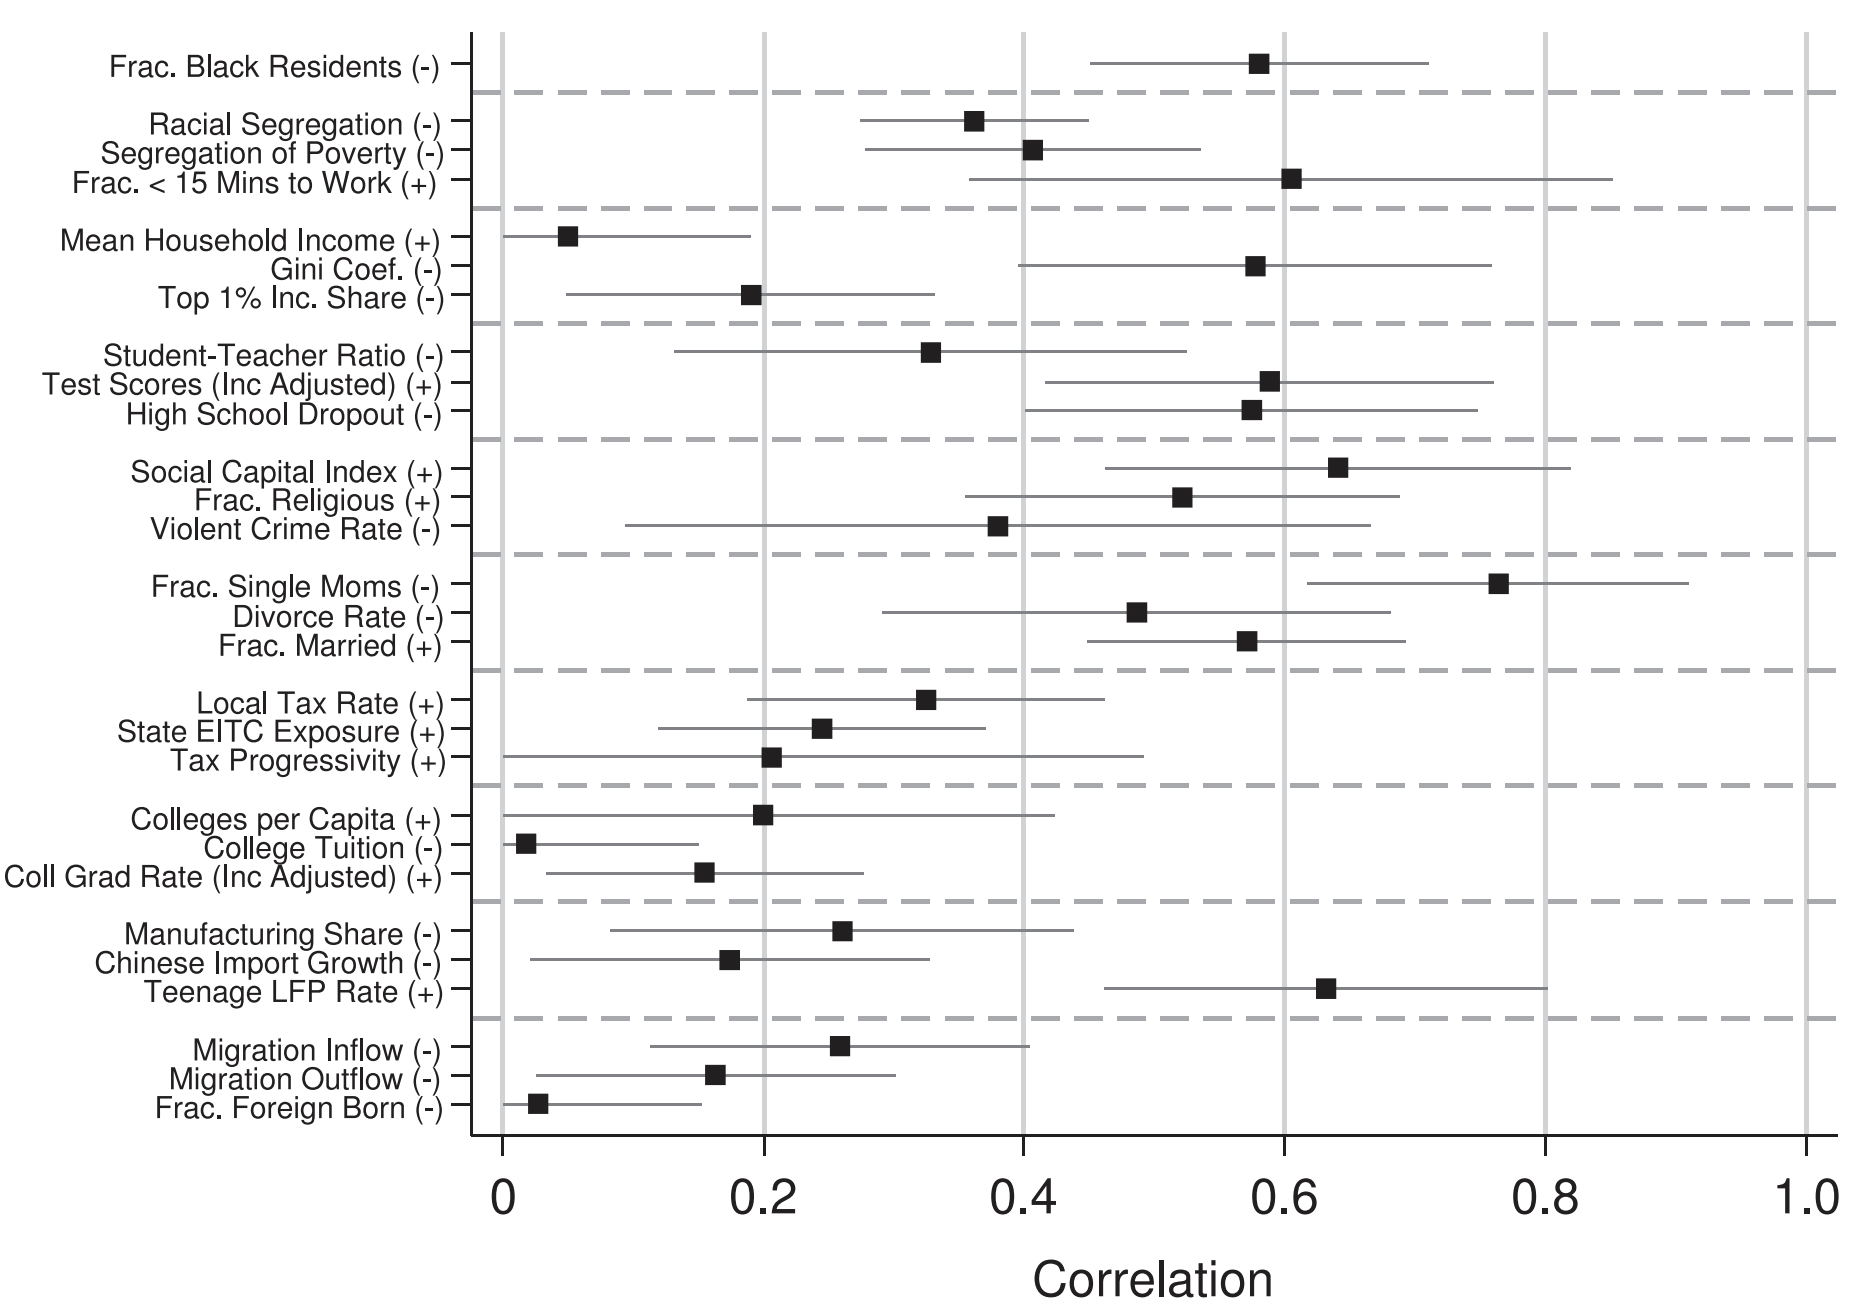
They also find significant heterogeneity at the race level: neighborhoods can be good for one race or economic level and bad for another.
Another major finding is that these effects decay rapidly with distance, where only people in a child's immediate area appear to have a significant impact:
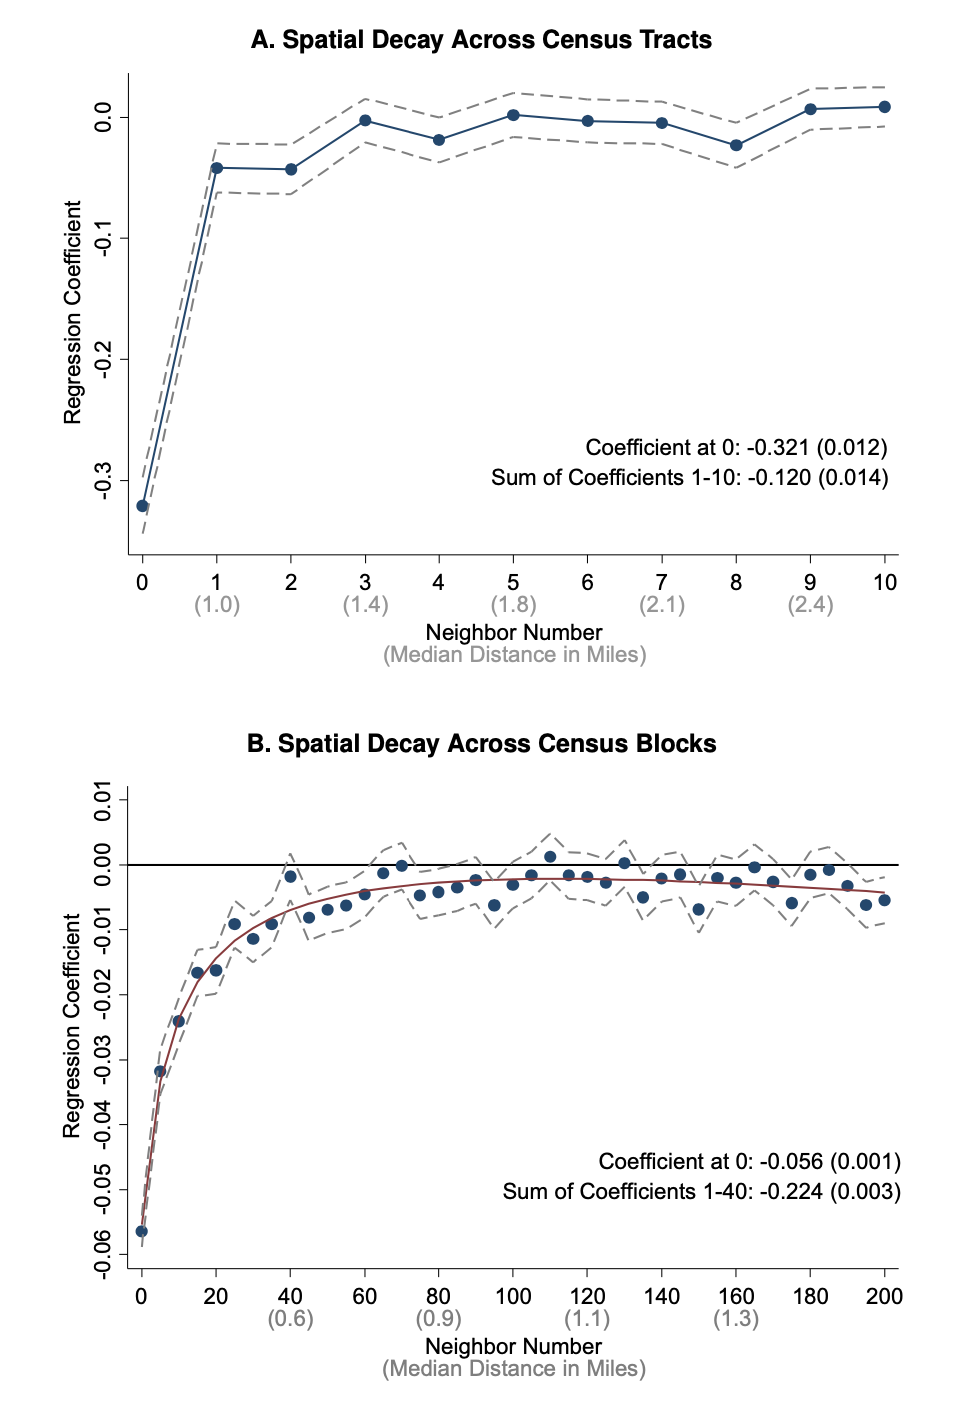
In keeping with these hyper-local findings, school catchment fixed effects explain 28% of the variance in these outcomes (i.e. r~0.53), which provides an upper bound on how important schools are.
On the other hand, effects vary very slowly across time: poverty rates in 1990 are nearly (91%) as predictive as poverty rates in 2000. This suggests that mobility estimates from historical data (e.g. this study) remain useful today.
This is all very interesting, but what are the actual effect sizes? If you're interested in your particular race/gender/income configuration, you can take a look yourself by doing some regression on the publicly available data Data Library: Publicly available data we've produced and replication code. However, I took a dive myself assuming the parents are white with the median income. Here are my general take-aways (from a regression including all mentioned variables, state dummies, and some other controls). I've taken the liberty of converting from percentile increases to percent increases by assuming we're at the 50th percentile.
- A 1-SD increase in mean neighborhood 3rd grade test scores is associated with a 0.7% increase in a child's income. Given that we're talking about an entire standard deviation in test scores this is a truly paltry amount.
- A 1-SD increase in mean neighborhood income (doubling) is associated with a 4.0% increase in a child's income. In other words, the elasticity between neighborhood income and child income is 0.06 - better than test scores, but still not terribly large.
- A move to an all-asian, -black, or -hispanic neighborhood is associated with a decrease in income of 1.9%, 2.6%, and 6.1%, respectively. A neighborhood with many foreign-born people see a boost of 8.0%. In general, these strike me as medium large.
- A move to a neighborhood where all children are in single-parent household decreases expected child income by 14.8%.
- A neighborhood where everyone over the age of 25 has gone to college sees a 13.7% boost to child incomes.
Those last two seem like fairly large effects!
One of the issues with this analysis is that, aside from income and race, it's really unclear whether the "effects" being described here are coming from neighbors or parents. That is, if you come from a two-parent household but literally all your neighbors come from one-parent households, how much should we expect to see your income drop? What if the reverse is true? The sum of these two effects is, supposedly, 14.8%. Ditto for the other variables.
Anyway, after accounting for all those variables, r^2=0.48. About half of this variance is due to the mean household income of the neighborhood. Much of the rest is captured by state dummy variables.
A back-of-the-envelope calculation suggests about 16% of the variance is due to sampling error. This suggests we've accounted for about 57% of the variance in neighborhood opportunity with these factors. The other 43% must be due to unaccounted-for neighborhood characteristics.
I suppose the tl;dr here isn't that surprising: neighborhoods and/or households that are wealthy, smart, educated, white, and married do best. There are some surprises, though.
For instance, who would've guessed that income predicted success 5x better than test scores? Or that the effects of neighbor race is similar to a 2x change in neighbor income. Yet still all of this pales in comparison to educational attainment of one's neighbors.
The finding that the children of foreigners do better than average seems odd at first, and I'm not sure I would've predicted it, but it makes sense when you flip it: the new immigrants (i.e. the parents) have depressed incomes due to a variety of factors that affect their children less.
But really, the greatest achievement here is the Opportunity Atlas The Opportunity Atlas - definitely take a look at that.
Education Quantity
I've addressed education elsewhere (see links) so this is a bit of a speed-round.
Bryan Caplan suggests that roughly half the correlation between educational attainment and income is causal - either through human capital generation or signaling. In longitudinal twin studies, an extra year of education is associated with ~7.5% higher income.
Curiously, despite the good evidence that earning ability is almost entirely determined by genes, luck, and choices rather than shared environment,
Tying this all together:
- A 1sd improvement in common environment boosts educational attainment by 0.6sd.
- Based on the correlational twin studies, the correlation between educational attainment and income is around r~0.2.
- Together, this suggests a 1sd improvement in common environment causes a 0.12sd increase in earnings via educational attainment.
- This implies ~1.4% of income inequality is due to variance in educational attainment caused by common environment.
The "1.4%" estimate is close enough to zero that I feel it is consistent with the income heritability literature, which suggests common environment should be ~0% of income variance. However, it does leave some room for the importance of environment on mobility: moving you kid's childhood up 1sd probably increases their expected income by ~4% via educational effects alone.
College Quality
For education quality (as opposed to quantity), some studies suggest that the selectivity of the college you attend has ~0 effect on your future earnings; others find effects roughly half as large as naive correlational estimates; Caplan personally thinks the effect is non-zero but quite small:
Punch line: moving from the bottom to the top quartile raises male earnings by about 12% and female earnings by about 8%.
Caplan and others' estimates don't generally make up for the high sticker prices of elite colleges from a net-present value perspective, so where you go to school probably has a negligible effect on your lifetime income, and a small but noticeable effect if you're going on scholarship.
However, based on my college rankings, I think conventional attempts to measure college quality fall woefully short. As with the "neighbors" section above, the actual answer may be to look at specific colleges rather than try to make sweeping generalizations.
Race
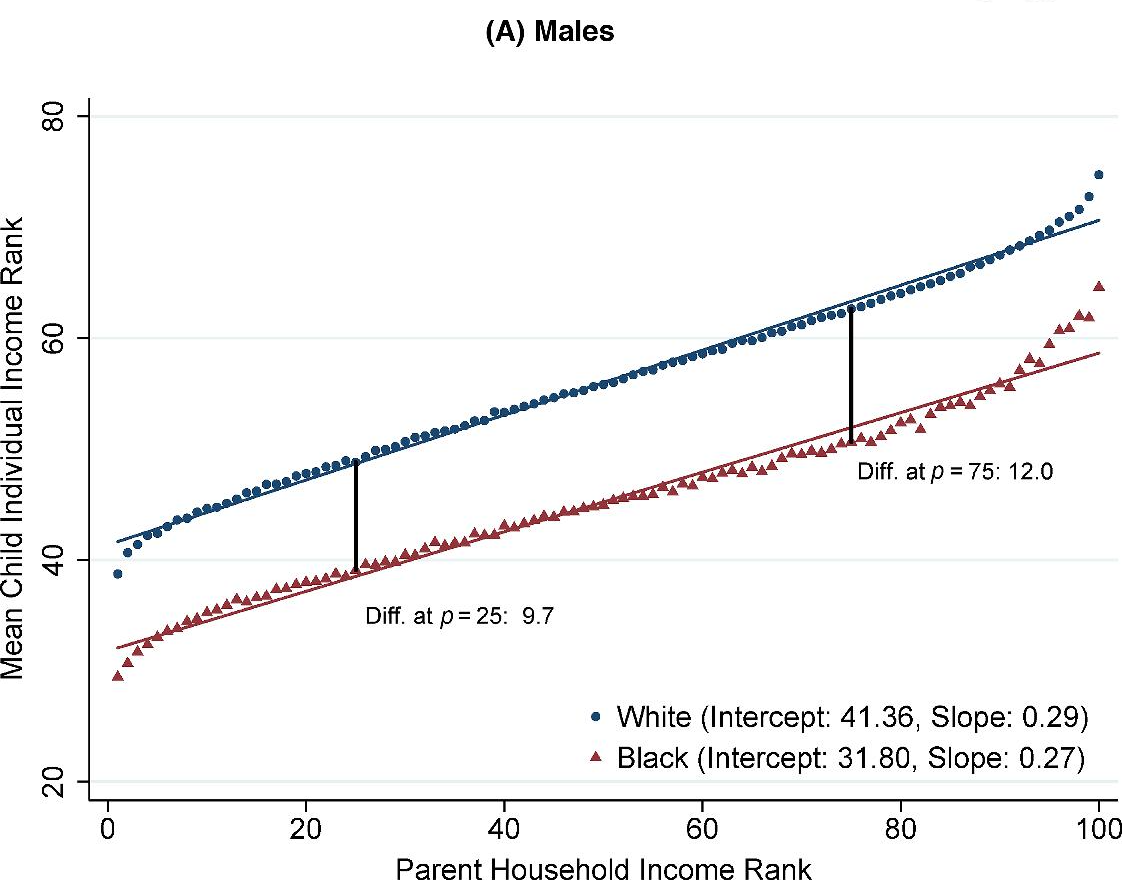
It is well know that large income differences are seen between races Racial pay gap in the United States, with most scholarship examining the difference between blacks and whites.
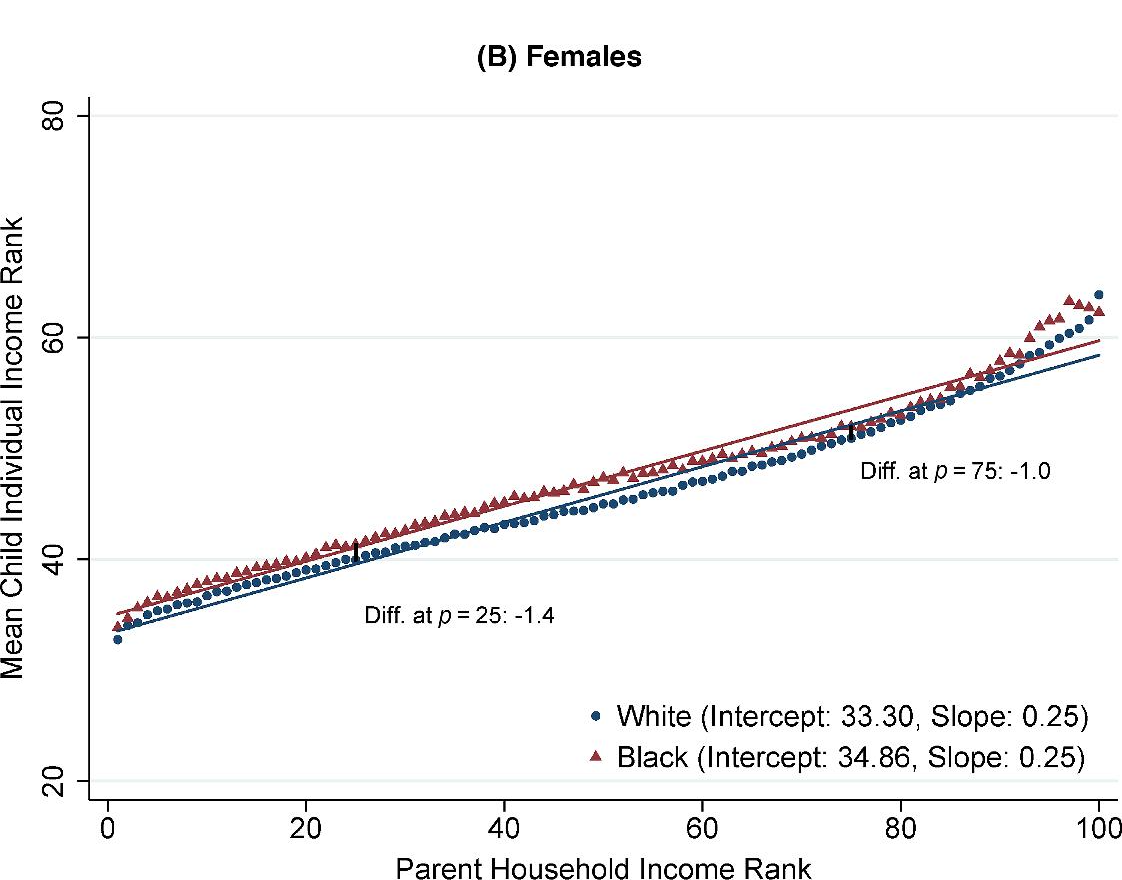
After controlling for parental income, this gap is "largely driven by differences in wages and employment rates between blacks and white men; there are no such differences between black and white women" Race and economic opportunity in the United States: An intergenerational perspective:
What drives this gap? One obvious contender is differences in hiring:
[ There's an argument to be had here about the extent to which the number of black felons is driven by bias in the justice system versus different true crime rates between races. ]
The hypothesis that felony convictions drive the black-white income gap via its effect on hiring is very tidy: felony convictions drive the vast majority of the black-white hiring gap, and the hypothesis explains the dramatic difference between males and females. The main problem is that (as far as I can tell) there is no good evidence relating these observed effects on hiring with effects on earnings. Without this link, the argument that "statistical discrimination" against felons drives the racial income gap is merely intriguing - not convincing.
Some other pieces of the puzzle:
- Black men are 5pp less likely to be in the labor force than white men, while black women are 4pp more likely to be in than white women Civilian labor force participation rate by age, sex, race, and ethnicity. Controlling for parental income, black women work slightly more hours than white women (~1pp), while black men work fewer hours than white men (~9pp) Race and economic opportunity in the United States: An intergenerational perspective.
- Controlling for parental income, the gap for college attendance is smaller between black and white women (~3pp) than between black and white men (~7pp) Race and economic opportunity in the United States: An intergenerational perspective and the difference in these gaps is even larger in college graduation rates Table 104.20.
- Controlling for parental income, the gap in incarceration is much larger for between black and white men (~6pp) than black and white women (~0pp), probably largely owing to how few women are incarcerated Race and economic opportunity in the United States: An intergenerational perspective.
More controversial is the hypothesis put forward by Herrnstein and Murray: that much of the gap in black-white income is driven by the gap between their average IQs Herrnstein. Even granting the hypothesis, it can't be the whole story, since it predicts a large and equal gap for both sexes, rather than just for men. At a minimum, proponents need to explain why black women earn as much as white women after controlling for parental income. Still there's no denying that the racial IQ gap throws a wrinkle in the discussion of the racial income gap.
For more analysis, see the Wikipedia page Racial pay gap in the United States.
Gender
I'm a big fan of the Wikipedia page for examining the earning gender pay gap Gender pay gap in the United States. A quick summary is that women earn ~19% less than men on average, but this gap tends to shrink when various factors are controlled for and, among certain demographics, the gap is actually negative. This is a very complicated topic that eschews straightforward explanation.