College Rankings v1
[ Deprecated in favor of this sequence. ]
A Survey of Existing Rankings
Quality Rankings- US News - the defacto standard; a weighted sum of various parameters with no clear rationale U.S. News Best Colleges
- Parchment Student Choice - treats each student as a chess game and each college as a chess player with an ELO rating; when a student chooses one college over another, that colleges "wins" a chess game against the other college Parchment Student Choice College Rankings 2022
- Niche - a variety of different rankings - notably including a ranking for "top party schools" 2022 Niche College Rankings
- Payscale's College Salary Report - ranking of colleges based on the median pay of their alumni Payscale's 2021-22 College Salary Report. They also offer a return on investment model Best Value Colleges. payscale
- Princeton Review - offers a variety of ratings including their "Best Value" ranking that pulls from the Payscale data and adjusts for expected costs. Princeton Review
- Georgetown - another ROI ranking Ranking ROI Of 4,500 US Colleges And Universities
- Brooking's Value-Added Rankings - a ranking of colleges based on how good their alumni's outcomes are controlling for the quality of the alumni Kulkarni
A Novel Contribution
A natural motivation behind the various economic rankings above is to determine which colleges are the best investments from an economic perspective. However, all of them have major problems.
Some don't control for obvious confounding variables such as students' races, SAT scores, and parental incomes. Others have the opposite problem: they control too much. For instance, if more selective colleges have both better effects on future incomes and students with higher SAT scores, then simply removing the naive SAT~income correlation will over-correct and remove the supposed effect.
The ideal solution is to perform a regression on individual students with (a) variables to control for students pre-existing qualities and (b) a dummy variable for each college. Then, assuming we've removed all confounders, the dummy variable estimates would be unbiased estimates of the actual effect each college has on its students' incomes.
This has largely been done using millions of tax returns . Income segregation and intergenerational mobility across colleges in the United States, but the authors (a) didn't report the dummy values and (b) didn't control for some variables that seem obviously important. I obviously don't have access to millions of tax returns, but what follows is my attempt to produce an analysis with what data we do have.
Test Scores
Some of the rankings control for standardized test scores while others do not. Neither strategy makes sense. If you don't control for test scores, you confound your ROI calculations because test scores correlate with both pre-existing ability and future earnings. If you do control for test scores, you end up confounding your results in the opposite direction since there is almost certainly a positive correlation between test scores and college quality.
To square this circle, you really want the correlation of SAT scores with income of students within a college. This slope would, presumably, be a good estimate of the important of SAT in predicting ability without being confounded by college quality. Put another way, we need a regression of student income versus student SAT scores with college fixed effect dummy variables.
I found one study to report this. It was reported in columns 5-9 of table XXII on the Online Appendix A Online Appendix: Income segregation and intergenerational mobility across colleges in the United States of "Income Segregation and Intergenerational Mobility Across Colleges in the United" . Income segregation and intergenerational mobility across colleges in the United States.
They find each 100-point increase in SAT score is associated with a 1.27 percentile increase in earnings at the age of 32-34. This is noticeably less than both the naive 2.73 slope and also the 2.24 slope that controls for other confounders but not college fixed effects.
So, controlling for fixed effects, a 100-point SAT score increase predicts a 1.27 earnings-percentile increase. Across the entire 100 percent range, a 1.27 percentile change is, on average, equivalent to a 0.060 SD increase. Earnings follows roughly a log-normal distribution such that a 1-SD increase corresponds to about a doubling in earnings. Hence, a 100-point increase on the SAT predicts a 4.3% increase in earnings.
Parental Income
Parental income predicts child income. As with the SAT above, we turn to Chetty et al . Income segregation and intergenerational mobility across colleges in the United States, but this time we don't need an online appendix - just Tables II and III. These table reports a regression that predicts child income based on dummy college variables and parental income. They find that 1 percentile increase in parental income is associated with a 0.095 percentile increase in child income.
Test Score & Parental Income Correction
However, parental income and SAT correlate with r~0.38,
To do so, we need the correlations of all three of these variable pairs:
- As mentioned income and SAT correlate at r~0.38.
- The 1600-point SAT score has a standard deviation of around 224 SAT: Understanding Scores so the 100-point increases used by Chetty are 0.45-sd increases. They are associated with 4.3% increases in earnings, which, using the fact that one standard deviation in income is about a doubling, means the effect size is 0.062-sd. 0.062/0.45 = 0.14, so r~0.14.
- The parent-child income slope reported by Chetty et al can be interpreted as a correlation since they're both converted to percentiles: r~0.095
From this we find the slopes for SAT and parental income should both be lower if we want to combine them in a linear regression. Per the math, we will reduce graduates income by 3.7% per 100 SAT points and 0.049% per 1% increase in parental income.
Other Variables
I believe it is more appropriate to suppose that a students' major say something about the student rather than their school. Ditto for their race. Unfortunately, in order to include these variables into the analysis, I have to assume that there is no correlation between major/race and SAT scores or parental income. This is presumably false, but it seems less bad than assuming the alternative: that major/race has no effect on later earnings.
Methods
The data is based on two datasets from Opportunity Insights Publicly available data we've produced and replication code https://opportunityinsights.org/wp-content/uploads/2018/04/mrc_table2.csv https://opportunityinsights.org/wp-content/uploads/2018/04/Codebook-MRC-Table-2.pdf https://opportunityinsights.org/wp-content/uploads/2018/04/mrc_table10.csv https://opportunityinsights.org/wp-content/uploads/2018/04/Codebook-MRC-Table-10.pdf
As our dependent variable, we will use median earnings 10 years since starting college with two adjustments:
- We will divide this by 1.037^((avg_sat_score-1051)/100).
- We will also divide this by
(median_parental_income / 74300)^0.049.
As discussed above, this is the sensible "middle way" between excluding and include SAT score and parental income as dependent variables.
Our independent variables will be (a) the percent of the student body of each non-white race and (b) the percent of graduates in each major-cluster. We will limit our analysis to schools that (a) offer 4-year programs and (b) have all the necessary data discussed above.
We run the full regression predicting the logarithm of the median earnings of each college's graduates. We considered using backward elimination to remove statistically insignificant results, but all our regression variables are dummies, which means doing so is dependent on the arbitrary choice of default value. We have to choose a default value
Next, we look at the residuals from this regression to infer the value of the college. Finally, we subtract 0.24 times the college's net price.
Results
To see the math and rankings, go here.
I tried changing the slopes for the SAT and parental income used to adjust alumni income by 10% in each direction. These tweaked ratings correlated strongly with the actual rankings (r > 0.999), so the rankings should be fairly robust against changes in these assumptions.
What Predicts College Value?
Caplan cites two studies estimating the returns to college quality: College quality and wages in the United States and How robust is the evidence on the effects of college quality? - both are based on the NLSY 1979 dataset.
When I ran a linear regression on my economic return estimates against a college's average SAT score, I found a 100-point increase in average SAT score was associated with a 2.7% increase in alumni income. How do the two studies compare? The first study found (Table 3) that a 100-point increase in a college's average SAT score is associated with a 2.8% increase in alumni income after controlling for a variety of student factors College quality and wages in the United States. The close alignment between my slope and their slope offers some confirmation that everything I didn't was complete bullshit. The second study doesn't provide enough evidence to answer the question.
What about other variables? Well, I performed a couple multivariable linear regressions. In general, I found
- Parental income was the best predictor of college quality (r~0.6)
- Once you accounted for parental income, acceptance rate and average SAT score both predicted lower college quality (r~-0.15 and r~-0.3, respectively)
- Whether a college was public, non-profit, or for-profit didn't strongly predict anything. Public schools had a slight disadvantage in predicting income (-2%), but a slight advantage in predicting net-value-added, presumably because they tend to be cheaper.
- Adding Barrons rankings into the mix resulted in no additional predictive value on top of parental income, SAT score, and acceptance rate. Adding the "tier" variable, on the other hand, is quite predictive. The "tier" variable gives each college a tier from 1 ("Ivy Plus") to 10 ("Four-year for-profit"). This tier system does predict value-added. I wouldn't read too much into this result, though. It largely ends up being an issue of statistical power.
This is quite interesting in my opinion. It suggests to me that the main benefit of attending an "elite" college is networking rather than working with gifted peers.
Advanced Degree Bias
Going to grad school almost certainly depresses income 10 years after matriculation, since many PhD holders will have either not yet earned their PhD at that point or have earned it immediately prior and have not yet reaped the job market fruits. This suggests these rankings are biased against colleges that send lots of their alumni to graduate schools. A similar argument holds for MDs.
I found a dataset that gives what percent of graduates from a college go on to get a PhD. The downside is this dataset only includes fifty colleges Fiegener. I cross-referenced this with my existing dataset (see spreadsheet) and ended up with 43 colleges with all relevant data.
Next, I tried predicting college quality with SAT score, parental income, and PhD yield rate. I found the SAT flipped back to being a positive predictor; parental income remained positive as always; and PhD yield negatively predicted college quality. This makes sense given the intuition above.
To get a feel for the size of this bias, see this figure The College pay off:
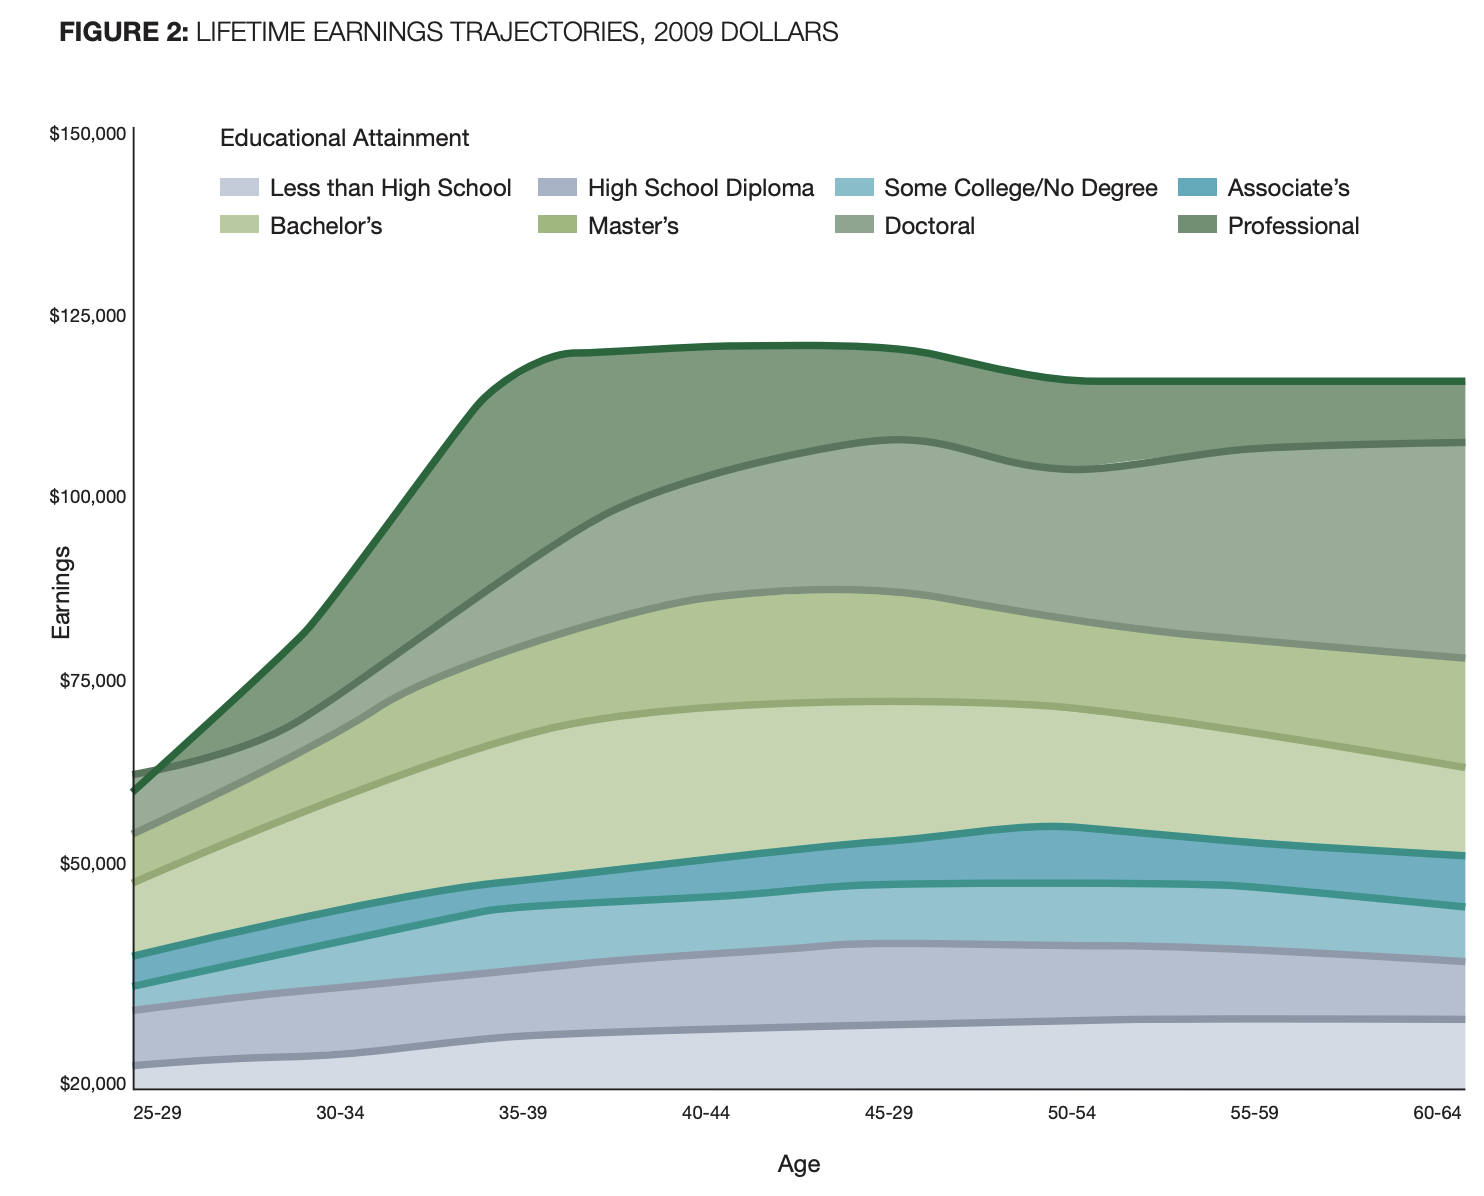
You can see that from age 28 to mid career, people with professional degrees or PhDs see around a 75% boost in pay. The boost for those with Bachelors degrees is only around 40%. This can seriously bias our rankings for a couple schools. The worst offender is probably CalTech, which sends a whopping 35% of its graduates to get PhDs. Just using the graph above, this suggests the rankings are biased against them by about 12%, enough to boost its ranking from #678 to #480.
To be clear Caltech is a serious outlier here. The #2, #3, and #4 schools in terms of PhD yield are Harvey Mudd (24%), MIT (16%), and Reed (14%). Still, this bias is significant and worth calling out.
Discussion
The desired interpretation here is basically: "How much would a white humanities student with average SAT scores and from a household with an income of $74300 earn if they went to this college? (net fees and assuming they graduate). I think the results are quite interesting. Here are the the top and bottom 10 colleges:
| College Name | Expected Net Income |
| Georgetown University | $68,198 |
| Washington And Lee University | $65,975 |
| Harvard University | $65,617 |
| MCPHS University | $63,989 |
| Babson College | $61,521 |
| California Maritime Academy | $59,865 |
| Massachusetts Maritime Academy | $59,527 |
| Lafayette College | $58,466 |
| SUNY Maritime College | $58,373 |
| ... | |
| Johnson & Wales University | $28,928 |
| Stephens College | $28,881 |
| Hawaii Pacific University | $28,734 |
| Southwest Baptist University | $28,651 |
| Lynn University | $27,972 |
| Bennington College | $27,679 |
| University Of The Ozarks | $27,347 |
| Northland College | $24,721 |
| Warren Wilson College | $20,295 |
| University Of Hawaii And Hawaii Community Colleges | $19,640 |
This ranking deviates quite a bit from other rankings. For instance, only about half of the top 10 colleges are very selective. Payscale and The Princeton Review are both topped by almost exclusively very selective colleges. Georgetown's rankings are more diverse regarding selectivity but they clearly skew heavily towards STEM-focused colleges. The Brooking's Institute barely has any selective colleges near the top. In other words, I've definitely come up with non-standard results.
These rankings have some unusual results too. For instance, MIT is ranked #118/811 while Caltech is ranked #678/811. My alma mater doesn't fair too well (#624) and my brother's fairs better (#123).
The dataset is based on a couple years of graduates, which suggests the 95% confidence interval on these ranking values are at least a few percentage points in each direction for most colleges.
The natural question is whether these are decent causal estimates or still hopeless confounded. Who knows? Maybe some of both?
The obvious set of potential confounders are admissions criteria: is Georgetown good at getting its alumni well-payed or is it good at identifying high-school students who will earn well even after controlling for SAT scores and parental income?
We only controlled for major cluster rather than major. It seems entirely possible that where students go within a cluster matters quite a bit (i.e. biology and computer science are both in STEM).
The rankings themselves suggest something funky is going on: why are maritime colleges doing so well??
Even if we accept these rankings, it's unclear whether this reflects anything regarding their didactical value or merely signaling.
All of this is to say, it's pretty clear these rankings shouldn't be taken as gospel truth of causal effects. Still, they seem at least as valuable as many of the rankings I mentioned at the start, so I think they're a worthwhile inclusion in the college ranking ecosystem.