The Causes of Income Inequality
The Causes of Growing Inequality
Between 1979 and 2018, real GDP per capita increased by 89.1% A939RX0Q048SBEA while median pre-tax wages increased just 6.3% LES1252881600Q. We'll call this discrepancy The Gap™. What explains it?
A Didactic Math Note
Suppose X = A * B * C. Suppose ∆X means "% increase in X".
Then, 1+∆X = (1+∆A) * (1+∆B) * (1+∆C)
So, ln(1+∆X) = ln(1+∆A) + ln(1+∆B) + ln(1+∆C)
I implicitly use this observation to determine what "%" of the gap various hypotheses explain: if ∆X = 0.8 and ∆A = 0.2, then % explained is ln(1+0.2)/ln(1+0.8) = 0.3102 = 31.02%.
Accounting Issues
Laborers are being paid more via benefits these days relative to historically. In particular, salaries and wages as a percent of compensation have decreased from 84.8% to 81.3% Table 2.1. This explains 6.6% of The Gap™.
The hawk-eyed reader will also note a definitional foible: the employment-population ratio. At the moment, we are comparing the median full-time wage to wages per capita. If more people are working now (as a percentage) relative to 1979, then that could explain part of The Gap™.
The hours-worked-per-person has increased 4.5% during this time period Table 6.9B Table 6.9D. It's not super clear how this affects the gdp-per-capita-to-median-full-time-wage ratio, but the most likely answer is that it should increase it by ~4.5%, explaining ~6.9% of The Gap™.
Finally, economists use CPI when converting nominal wages to real wages, but they use the GDP deflator when converting nominal GDP per capita to nominal GDP per capita. During this time frame, CPI increased 3.460-fold CPIAUCSL while the GDP deflator increased 2.848-fold USAGDPDEFAISMEI. In other words CPI has grown 21.5% faster. This accounts for 34% of The Gap™.
This raises the question of why the CPI grows faster than the GDP deflator. There are really two possibilities.
The first is that the two indices measure different sets of goods and services. CPI is constructed to represent what typical consumers buy while the GDP-deflator is based on price of all finished goods and services produced in the country. Loosely speaking, if GDP is represented as C + I + G + X - M, CPI includes C and some of M while the GPD deflator includes C, I, G, X, but not M. It's possible that prices have grown faster for C and M than for I and X. Alternatively, its possible that the CPI's basket of goods doesn't actually represent all consumption.
The second explanation relates to book-keeping minutia. The concept of "overall price change" isn't mathematical and attempts to define it mathematically have led to two competing definitions: Laspeyres and Paache indices. The former is biased upwards relative to the latter, but neither is "true" in some platonic sense. CPI is a Laspeyres index while the GDP deflator is a Paasche index, which means CPI will overstate inflation relative to the GDP deflator.
If we apply GDP methodology to just consumption (instead of GDP), we find CPI has grown 19.6% faster DPCERD3Q086SBEA, which represents 92% of the CPI-GDP-deflator difference. This suggests methodological differences 28.1% of The Gap™. This in turn suggests (but doesn't prove) that the different sets of goods and services accounts for only ~8% of the growth while the index type accounts for the vast, vast majority of it.
All the above issues suggest that roughly 41.6% of The Gap™ isn't due to underlying economic conditions but simply due to various "accounting issues". The Gap™ was 89.1%, but The True Gap™ is ~41.5%.
From this point forward, I'll be focusing on The True Gap™, because the accounting issues seem to be irrelevant from a sociopolitical perspective.
Capitalists
Maybe the owners of capital are making off with all the money rather than the laborers. During the same time period, labor compensation as a percent of GDP decreased from 57.2% to 53.2% Table 2.1. Table 1.10. This explains ~20.9% of The True Gap™.
Taxes and Transfers
The measurement of median income we've been using has been pre-tax median income. However, taxes have changed since 1979 and this could affect median post-tax. Fortunately The Economist has looked into this Inequality or middle incomes: which matters more?:
In short, they've found that changes in taxes and transfers have caused median household income to increase ~22% during the time period.
Another analysis found the post-tax-and-transfer Gini index has (if anything) fallen Gramm:
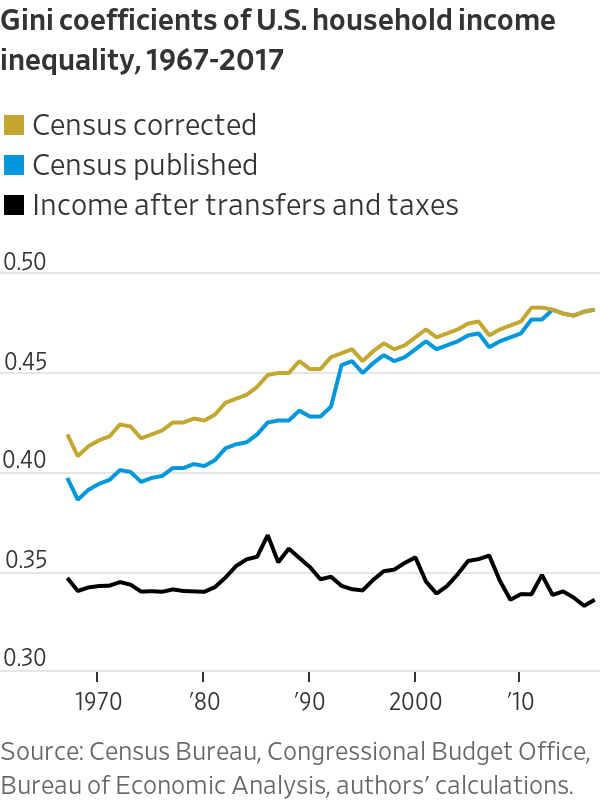
Note, this gini index estimation is significantly lower than The Economist's:
This point on taxes and transfers is very important in general, and bears more investigation. However, it's fairly independent of the rest of our analysis on this page, so we'll ignore it going forward.
Labor Compensation Distribution
This leaves us with ~32.8% of The Gap™ and ~79.1% of The True Gap™ to explain. As far as I can tell, the only factor left that we haven't accounted for is the distribution of compensation for labor.
There are lots of theories regarding why the distribution of labor compensation has grown less equal Economic inequality, some are
- The difference in average earnings between various education level is growing.
- Unions are becoming less common.
- The minimum wage is falling relative to inflation/the median wage/the mean wage/GDP per capita.
- Technology is making low-skill jobs obsolete/lower-paying
- The ability to trade freely is causing low-skill jobs to be offshored.
- Some wealthy groups are influencing government policy to make themselves yet richer.
I'm not going to go into which of these is true or how much of The Gap™ they account for - mostly because I'm deeply uncertain and that kind of analysis is difficult.
There's also an intersectional theory here posed by Malcom Gladwell Gladwell, who argues that inequality has largely been driven by the most talented laborers taking more of the pie from capitalists.
TODO Gabaix
Demographics
The above analysis sidestepped a lot of demographic issues by looking at median income of a full-time job and real GDP per capita. However, demographic changes have also stifled median household income growth. Though a whole books could probably be written on this, I'll focus on just two: household size and assortative mating.
Between 1979 and the present, the average household size has shrank from ~3.1 to ~2.6 Fry. Given a fixed budget, squeezing more people into fewer households makes money go further, so this has contributed to the sense that living standards aren't rising as quickly as they "should be". Using the square root equivalisation Equivalisation. In Wikipedia, this suggests shrinking household sizes have reduced living standards by ~9.2% over this time period.
Moving on to assortative mating: over the decades, the correlation between spouses' educations and incomes have increased, this has increased income inequality, an effect amplified by the entrance of women into the workforce. In fact, Greenwood, et al. end up concluding Greenwood
If people matched in 2005 according to the 1960 standardized mating pattern there would be a significant reduction in income inequality; i.e., the Gini drops from 0.43 to 0.35.
This is further confirmed by observing the correlation between husbands' and wives' incomes Schwartz:
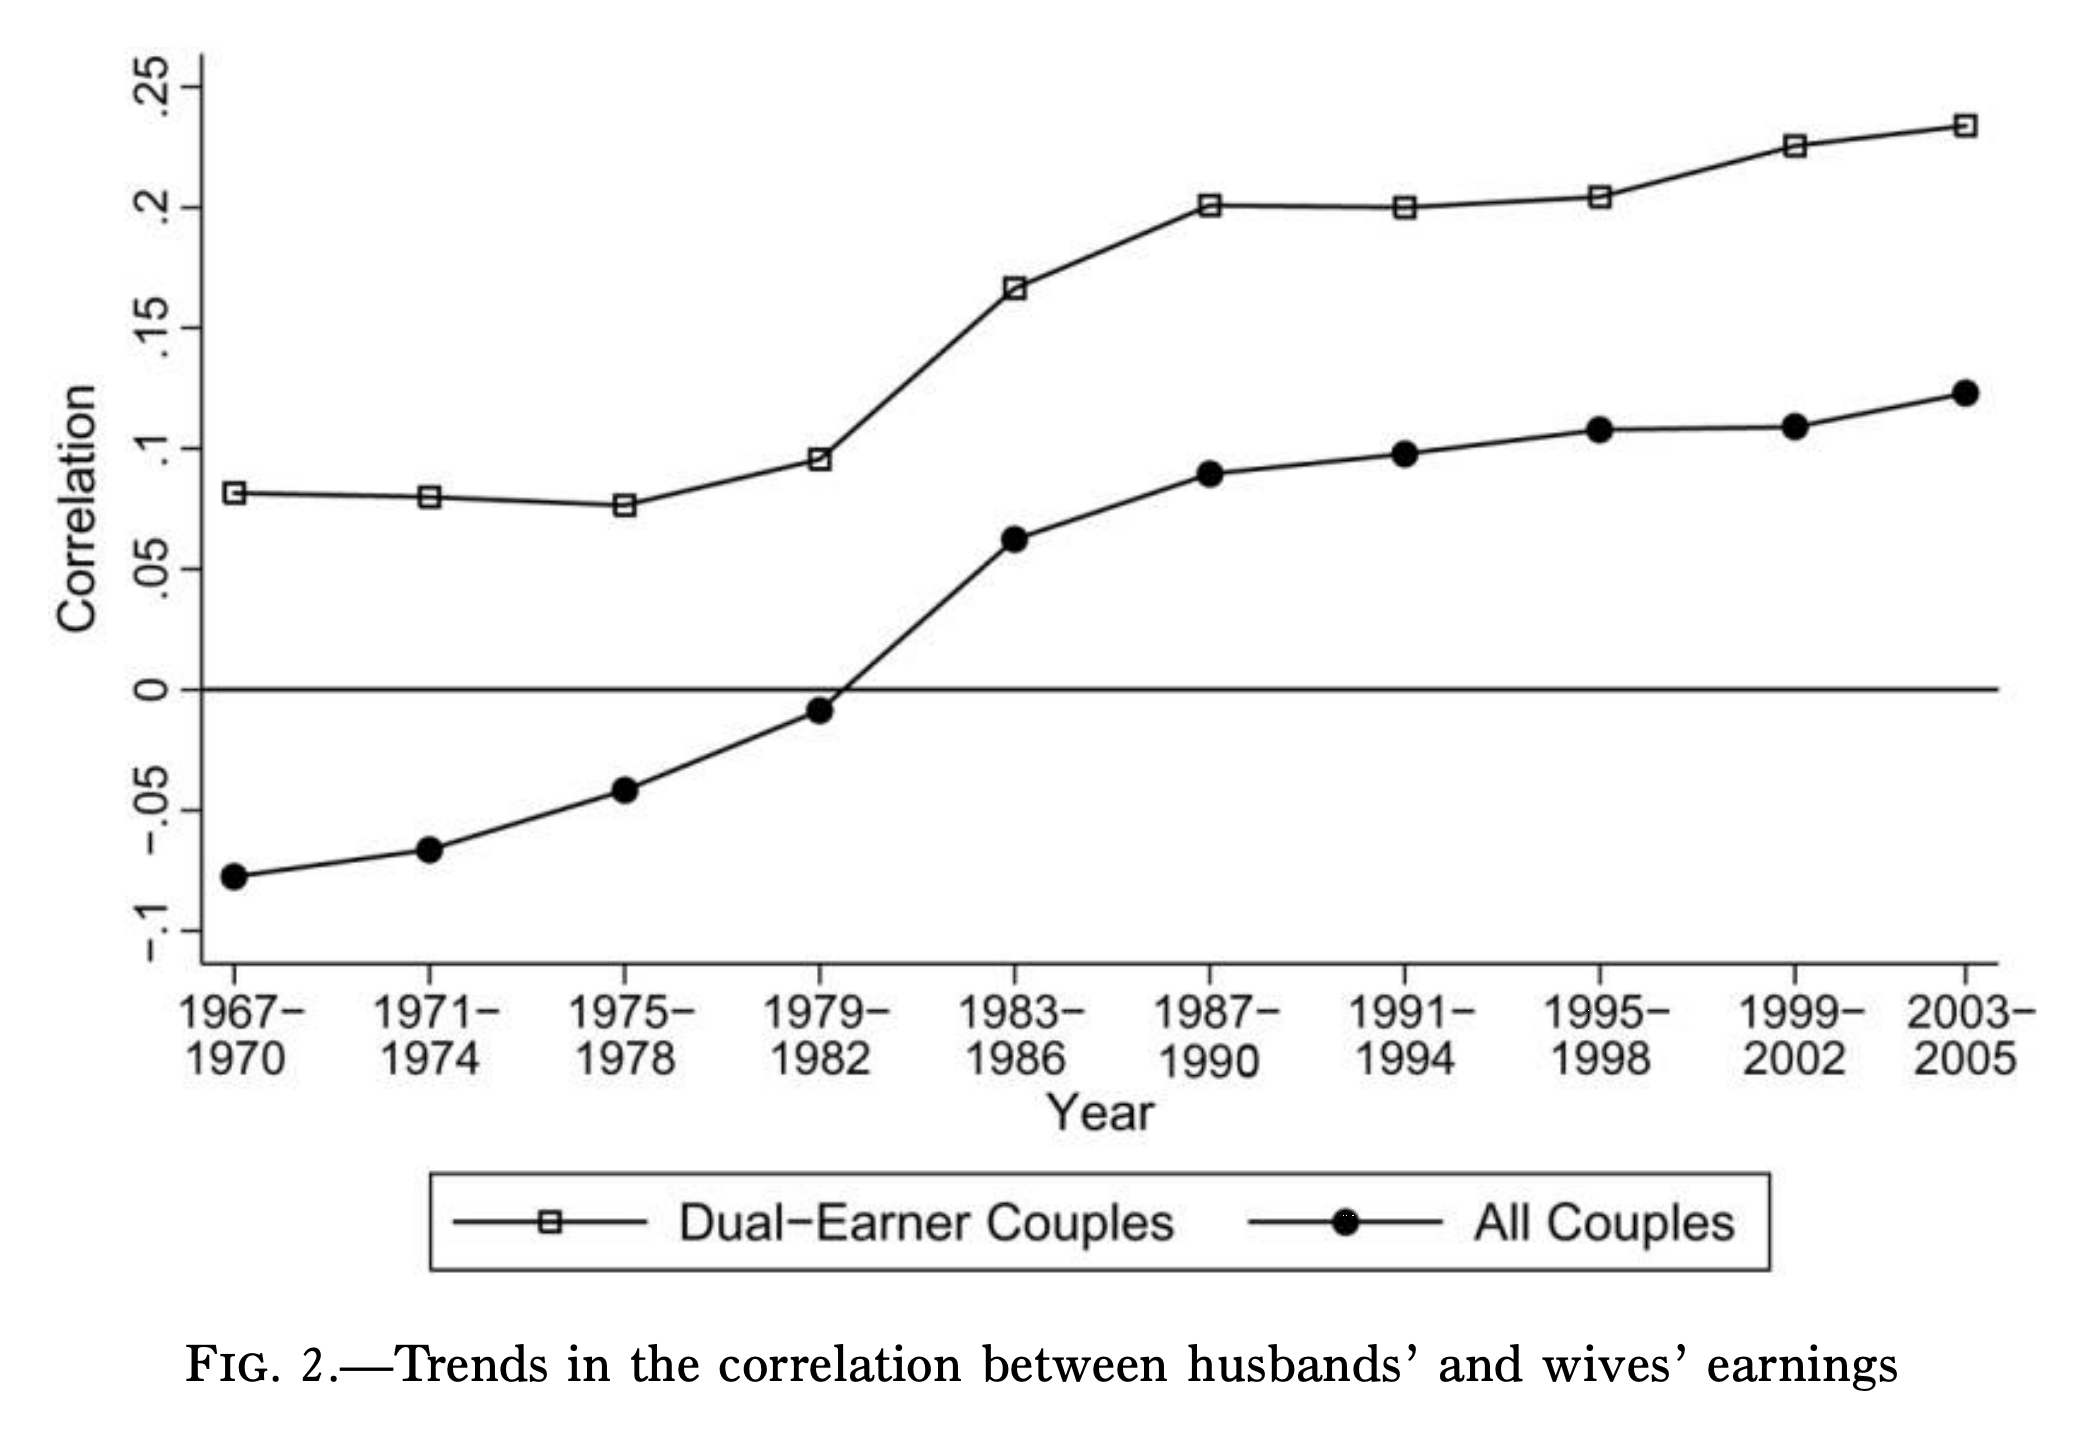
To give you a sense of the magnitude, between 1979 and 2016, the Gini index in the US rose from 34.6 to 41.4 SIPOVGINIUSA. It's likely that a majority of the increase at the household level is due to increased assortative mating.
TODO Eika Daly
General Causes
Twin Studies
Twin studies Twin study can be used to estimate what proportion of income differences are due to genes, shared environment, and unshared environment. Shared environment is defined as the portion of environment siblings share while unshared environment is a catch-all bin for everything else.
The most reasonable interpretation of the data is genes account for 50-60% of the variance in male lifetime income, while shared environment accounts for 0-10%, leaving 30-50% to "unshared environment".
One view is that 0-10% of variance being explained by shared environment looks pretty small: even if we raised all children in the same environment income inequality would only shrink by about 0-10%.
The other view is that we should be looking at effect size rather than variance explained. Taking the square root of 10% yields 0.32. We can interpret this as meaning
Take two average clones, B and G. Suppose B is raised in a bad environment (bottom 10th percentile), and G is raised in a good environment (top 90th percentile). Then (on average), we'd expect B to end up in the 33rd percentile of income while G would end up in the 66th. That is, G would earn nearly twice as much as B due solely to their environments.
Which interpretation is right? Both. They only seem contradictory because human statistical intuition is mediocre.
Ultimately, the former (0-10%) interpretation is more useful if you care about the inequality of outcomes while the latter (0-0.32) is more useful if you care about inequality of opportunity. We're focusing on the former here (see here for the latter).
Race, Sex, and College
The National Longitudinal Survey of Youth NLSY97 is following about 9000 students born between 1980 and 1984 and asked them thousands of questions over several decades. It's also one of the most mined datasets in social science - the kind of thing where, upon reading it, you see it pop up all over the place.
It lets us find, for instance, that
- Whether you're black explains 3% of income variance.
- Whether you're male explains 4% of income variance.
- Whether you have a Bachelors degree explains 9% of income variance
These correlational estimates probably place an upper limit on how much each of these factors cause income inequality. Education in particular probably only causes about half of its premium, which means education probably only causes about a quarter of the variance. So ultimately these three factors probably cause at most 12% of income inequality combined.
Moreover, the black gap hasn't really changed over the last several decades and the male-female gap has shrunk, so neither of those explains the increase in inequality.
It's worth noting, the fact that these three factors explain little of total income inequality or its change in the past several decades does not imply these three factors are "small" in an intuitive sense. As previously mentioned, The Gap™ between high school graduates and college graduates is ~70%, The Gap™ between blacks and whites is of a similar magnitude, and The Gap™ between men and women is ~30%. These are obviously large differences - they just don't explain a lot of overall income variance because income is distributed so nonuniformly.
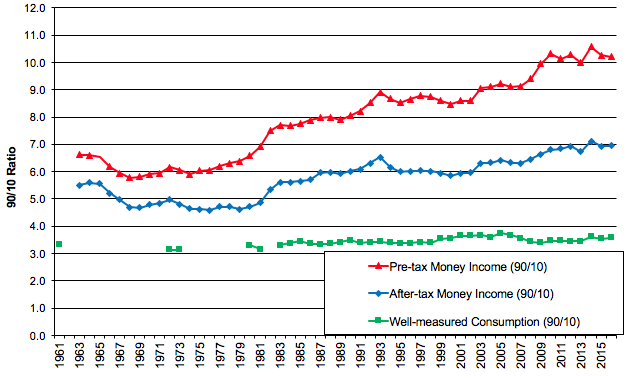
Consumption
Finally, there are good arguments that income inequality matters less from a human welfare perspective than consumption inequality. The latter has grown much more slowly over the last several decades Meyer:
Summary: Why Is Income Less Equal?
Real GDP-per-capita has increased 1.65% per year over the past 39 years. After accounting for various accounting issues, the median after-tax compensation has grown a slower: about 0.69% per year. The reason for the remaining 0.96% gap is split between capitalists earning more of the pie (0.19%) and labor compensation growing less equal (0.77%).
On the other hand, increasingly progressive taxes and transfers have added 0.59% to median after-tax income growth. This, combined with the accounting issues, has meant that after-tax income has lagged GDP-per-capita by only 0.37% per year - a far cry from the 1.65% lag the unadjusted numbers show.
Genetic differences cause about 40% of income inequality, while shared environment explains just 11%. Even so, childhood environment can cause large changes in expected child income.
Obvious "categories" like sex, race, and educationoal degrees explain at most 12% of overall income inequality, some of which certainly overlaps with the shared-environment percentage. These categories explain little of income inequality growth over the last 4 decades.