Coronavirus Modeling
Current Graphs
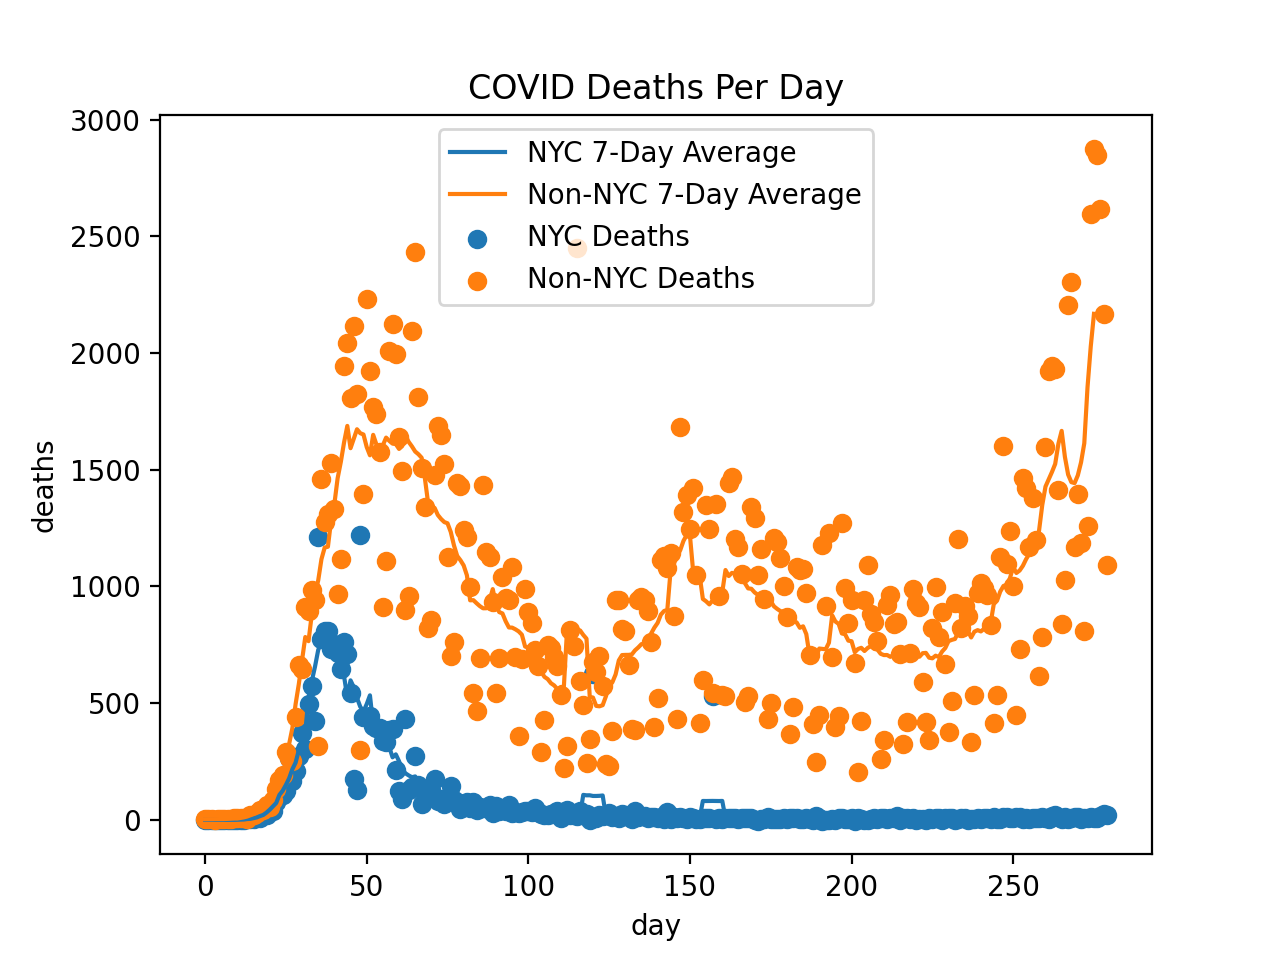
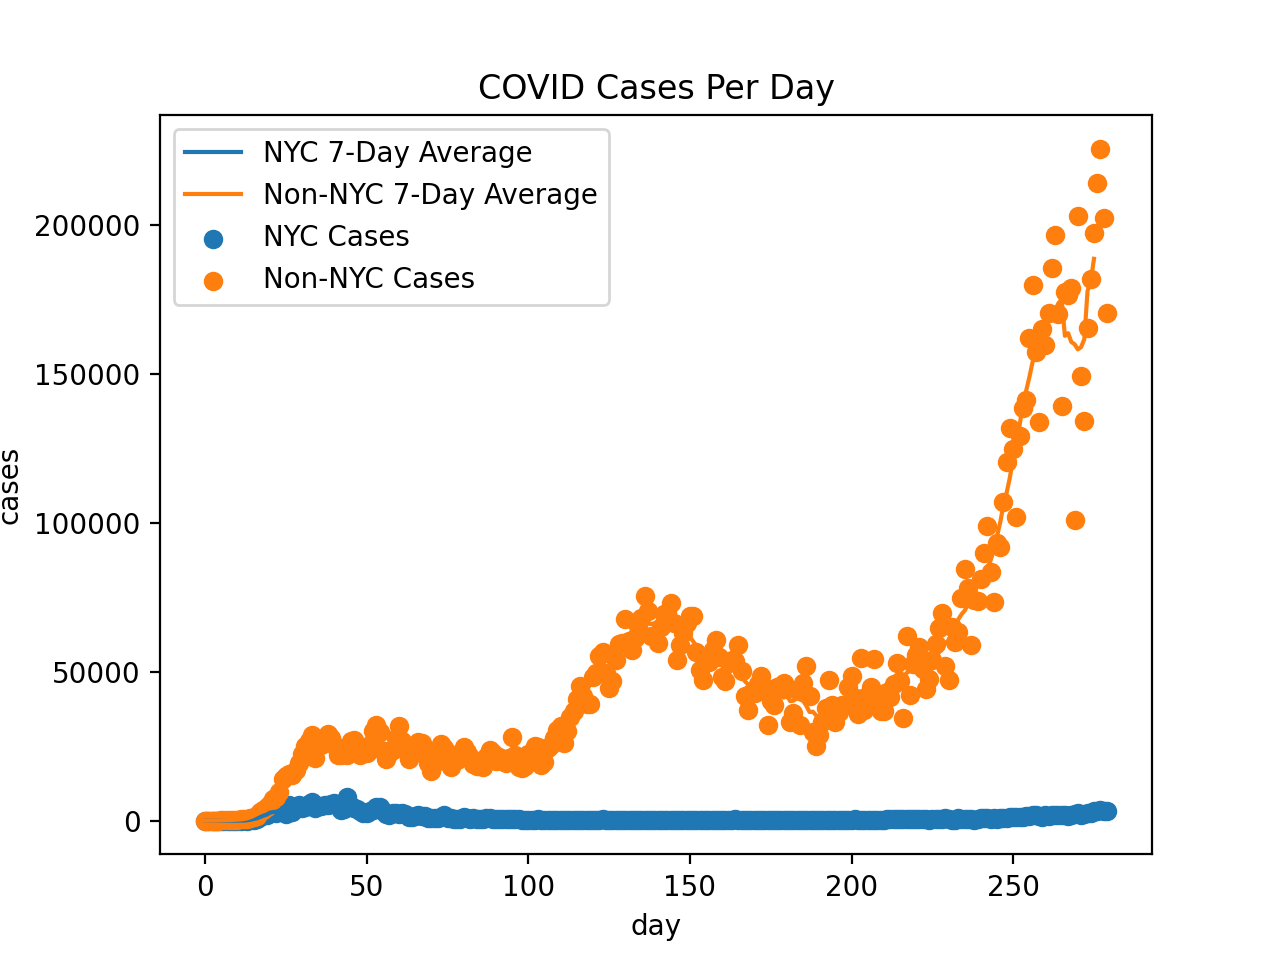
Although it looks noisy, there is actually a very noticeable 7-day cycle in death reporting. This can be seen by the 7-day average I included in the charts and by noting that I tried (e.g.) 5-day averaging and saw weekly spikes. I'm guessing R~1.3 at the moment.
In the US, 178,410 people have officially died of COVID, and 5,792,911 people have tested positive.
I also looked at the people in Wisconsin who didn't live in Madison or Milwaukee. We've had 64 deaths in the past 2 weeks, which suggests we have about 3600 cases per week, so the odds of the average person being infected this week is ~0.08%. Multiply by the 0.9% fatality rate and the expected cost to the average person from COVID next week will be about 2 hours of conscious life.
Symptoms
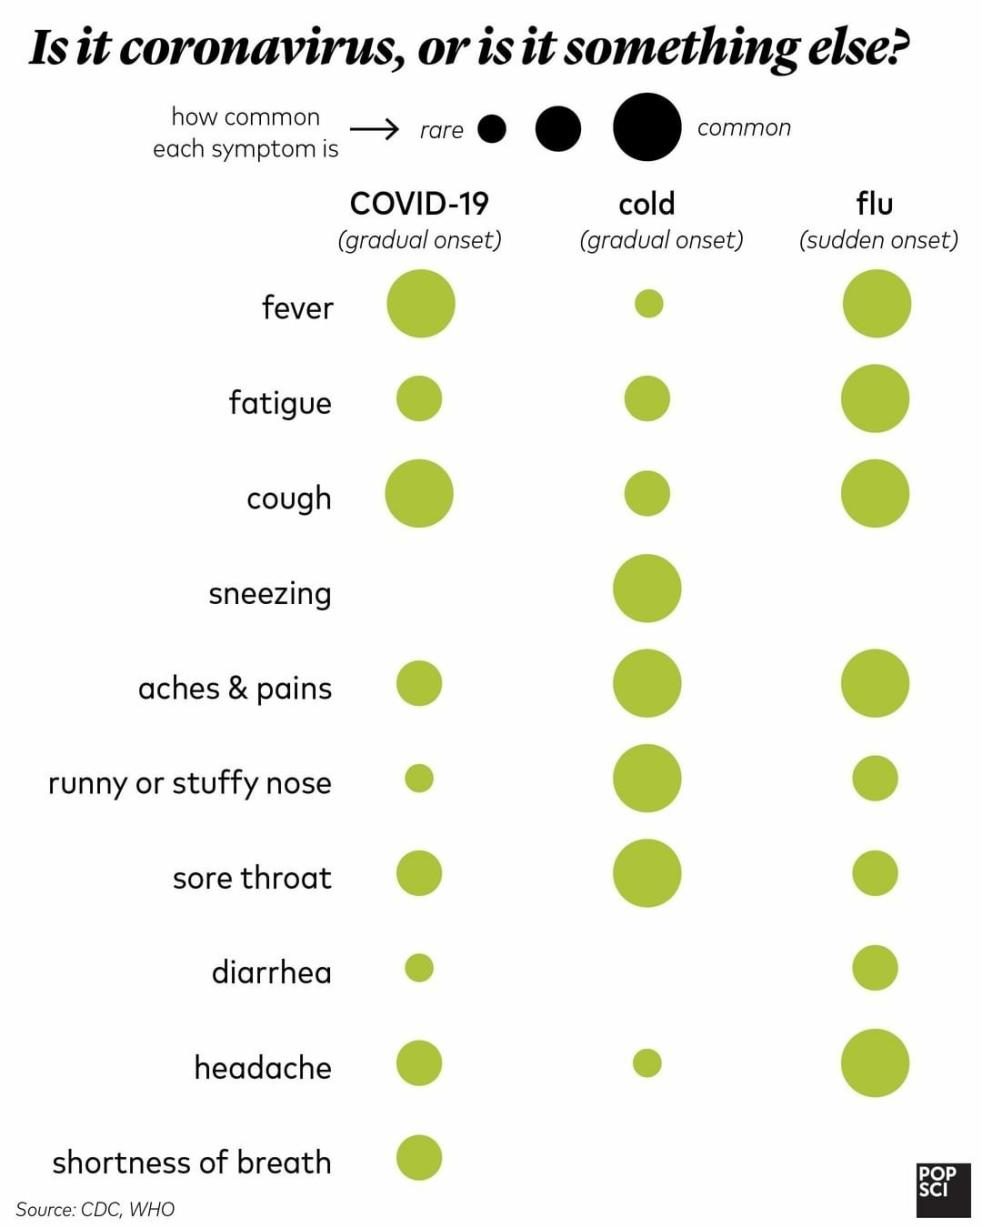
From the World Health Organization Coronavirus.:Common signs of infection include respiratory symptoms, fever, cough, shortness of breath and breathing difficulties. In more severe cases, infection can cause pneumonia, severe acute respiratory syndrome, kidney failure and even death.
From popsci.com:
The above graphs are based on data provided by the New York Times https://github.com/nytimes/covid-19-data and covidtracking.com.
My Model (Mar 10th)
There are several reasons to think the official number of coronavirus cases dramatically underestimates the true number of people infected:
- It can take many days to show symptoms and these people don't get tested. This affects undercounting even more than you might initially think due to coronavirus' high growth rate.
- Even among people with symptoms, mild cases will likely not go to hospital to get tested.
- The FDA and CDC caused testing to be significant delayed in the US.
On the other hand, the official death count is likely much more accurate. So it'd be nice if we could predict the number of cases from that. This chronicles my attempt to do so.
A model is only as good as its assumptions. Here are ours (with sources):
- The number of non-China global coronavirus cases have grown by 18% every day like clockwork CSSE. I'm excluding China because including that data makes the growth "lumpy" Novel Coronavirus (COVID-19) Situation.
- I've seen mortality estimates ranging from 0.7% to 3.5%. We will use 1.5%.
- It takes between 2.1 and 11.1 days to develop symptoms after getting the virus. This was determined by studying people who visited Wuhan and then got sick based on the assumption the got the disease in Wuhan Backer. The study found the mean was 6.4 days and the standard deviation was 2.6 days. A log-normal distribution fit this reasonably well, so we'll use that to model this part.
- It takes 6 to 41 days to die after developing symptoms Tang. The median number of days is 14. Based on this fat tail, we will model this with an exponential distribution with minimum 6, median 14, and maximum 41.
- We will assume independence between the number of days to develop symptoms and the number of days between first symptoms and death. I'm not sure how reasonable this is - intuitively, less healthy people would have smaller numbers on both metrics. However, I have no data regarding this point, so I will proceed, regardless, but note that this assumption may bias my estimate of total infected upwards somewhat.
- We will assume an infinite population, which means this model is only good during the exponential (early) stage of the outbreak.
Based on (2-5), we can construct a PDF that tells us how likely someone is to die after N days for any N. The resulting distribution is skewed right and has a mode of 17 days.
From this, we can deduce the ratio of the total number of coronavirus cases so far to the total number of coronavirus deaths so far (RATIO). Even with our assumption, RATIO changes quite a bit during the first several weeks of the outbreak. However, since we're at least 55 days into the US outbreak Holshue, that shouldn't matter. Given all of this, the ratio comes out to be 1225. The code can be found here.
Since the US has 29 coronavirus deaths so far /u/etche, this suggests we currently have 35,525 cases - 34 times higher than the official count.
Sensitivity Analysis
One thing that's easy to show is that RATIO is inversely proportional to the mortality rate: if the mortality rate is actually 0.75%, then RATIO should be twice as high, and we'd expect the number of cases to be 71,050.
The other variables are trickier to analyze mathematically, but still quite easy via simulation:
- If the growth rate is actually 19% instead of 18%, then RATIO increases by 14%.
- If we shift the bell curve for days-until-symptoms to the right by one day, RATIO becomes 18% higher. The same is true if we shift the days-from-symptoms-until-death curve over one day.
This is all to say that there is quite a bit of uncertainty, probably on the order of 5x.
Update: March 12
On March 10th, there were 29 deaths and just over 1000 official cases. Now there are 41 deaths and 1,715 official cases. My model predicts 50,225 cases now rather than 35,525.
That represents a daily growth rate of around 19%. Note: this effectively just means the number of deaths has grown by 19%, which is remarkably close to my original estimate of 18%.
Whereas on the 10th, I estimated that the government knows of just 2.9% of actual cases, this has risen to 3.4% - presumably due to improved test rollout.
I also added estimating the number of Americans with symptoms today. The estimate is 18,942. By that metric, our government does a little better: a 9.1% detection rate.
Update: March 13: Mortality
I found a reliable non-WHO source for the mortality rate. They claim estimates range from 0.4% to 2.9% Lombardi. It's good to finally leave the WHO's estimate of 3.4% behind, since it's obviously upwardly biased since its just (deaths ÷ official cases) and the official count of cases is probably ~10x lower than the true count of cases. Others argue it's biased the other direction because deaths lag the official case count by a couple weeks, but I'd be shocked if this had the same kind of ~10x effect.
The geometric mean of the estimate range is 1.1%. Personally, I think the 3.4% WHO estimate is so biased that the 2.9% is extremely unlikely, which makes me think the 1.1% estimate is a tad high. I'm just gonna use 1% going forward.
Today's numbers are 2286 official US cases, 49 official US deaths. The tweak in the mortality rate assumption and the growth in deaths since yesterday ups my models estimates to 90,000 currently infected in the US and 34,000 with symptoms.
Last week the number of non-Chinese cases grew by 17%, and part of that was a significant spike between March 12th and 13th (due to improved testing?). The week before that, it grew by 21% (and 22% the week before that).
This is good news. The question is how good? Applying my model to the non-China 2,235 deaths suggests that the number of non-Chinese cases numbers is around 41 million. With a naive logistic model, it suggests the number of global cases will peak around 4x the current number - that's 164 million total using my model, so ~1.6 million dead by the end of this. On the other hand, this might just be noise.
A prediction market estimates the number of official cases by the end of March will be around 400,000 Hypermind, which implies an average of about 9% growth per day. That, in turn, suggests either that my forecast is too morbid or that carrying out more than 20,000 tests per day is optimistic.
Curiously, I reproduce the 400,000 prediction by assuming (a) no more cases in China and (b) fitting a logistic regression curve to the current numbers. This makes it look to me like the markets are fitting a logistic regression to the official number of cases rather than trying to fit it to the actual number of cases.
This sounds terrible, but, honestly, the fact that the growth slowed is very positive news compared to more of the same.
US cases have averaged 36% daily growth in the past week. I'm deeply suspicious of US case-growth rates due to dramatic changes in propensity to test. I also think it's a mistake to ascribe a drop in global coronavirus growth to the US since many countries are taking drastic steps while we've taken basically one: forbidding non-American travel from Europe or China.
All this is to say: there is a small ray of sunshine for the global pandemic and we have no way of knowing if that ray reaches the US due to our botching of the whole testing thing.
Update: March 13: Ventilators
One issue that's become popular is whether/when we will have more people who need mechanical ventilators than have them. I'm going to try to answer that question.
By pooling data from Wuhan (China) Huang and Jeddah (Saudi Arabia) Al-Hameed, we get a sample of 21 people admitted to the ICU, 20 needed mechanical ventilation, and 11 died.
This suggests the eventual number of ventilators needed is equal to (1.9) times (the peak number of deaths per day) times (the average number of days on the ventilator before death).
I don't know the mean days on a ventilator, but the median is 9 days Al-Hameed. 1.9 times 9 = 17, so we should expect peak ventilator need to be about 17 times the peak number of daily deaths.
The US has about 8,900 in reserve ventilators in reserve and about 160,000 ventilators Ventilator Stockpiling and Availability in the US in hospitals. 8,900 ÷ 17 = 524, so we should be more-or-less fine so long as deaths remain under 524 per day. If deaths go above that, the question becomes how many of those 160,000 ventilators are currently needed.
Whatever the true threshold, since the mortality rate of people needing mechanical ventilation is around 50%, we should expect the mortality rate to be doubled to the extent the number of ventilator-necessary cases exceed that threshold.
Update: March 14: Quarantine
On March 11th, we left Santa Clara and came to Waukesha. We're quasi-quarantining for several days, because (based on my math) we have a 1-in-1000 chance of having the virus.
However, since we have the PDF of how many days it takes for symptoms to develop and we have the PDF over the probability we were infected each day (just an exponential growing by 18% each day). This is a situation where I do feel safe assuming independence.
Using similar math to the simulation linked above, I computed a PDF over how likely we are to have caught the coronavirus in Santa Clara given that we haven't seen symptoms X days after leaving, assuming a prior of 1-in-1000 in Santa Clara and that the odds are 14 times lower here in Waukesha (implies by the 1 symptom in a county of 400,000). Finally, we'll continue assuming an 18% growth rate.
The results are:
| Day | My Odds | Locals' Odds |
| 0 | 568 | 53 |
| 1 | 504 | 62 |
| 2 | 437 | 73 |
| 3 | 378 | 86 |
| 4 | 330 | 102 |
| 5 | 297 | 120 |
| 6 | 278 | 142 |
| 7 | 272 | 167 |
| 8 | 277 | 197 |
| 9 | 294 | 233 |
| 10 | 322 | 275 |
| 11 | 361 | 324 |
| 12 | 411 | 383 |
| 13 | 474 | 451 |
It will take roughly 10 days for me to reach that level of risk.
Update March 15: Raw Data
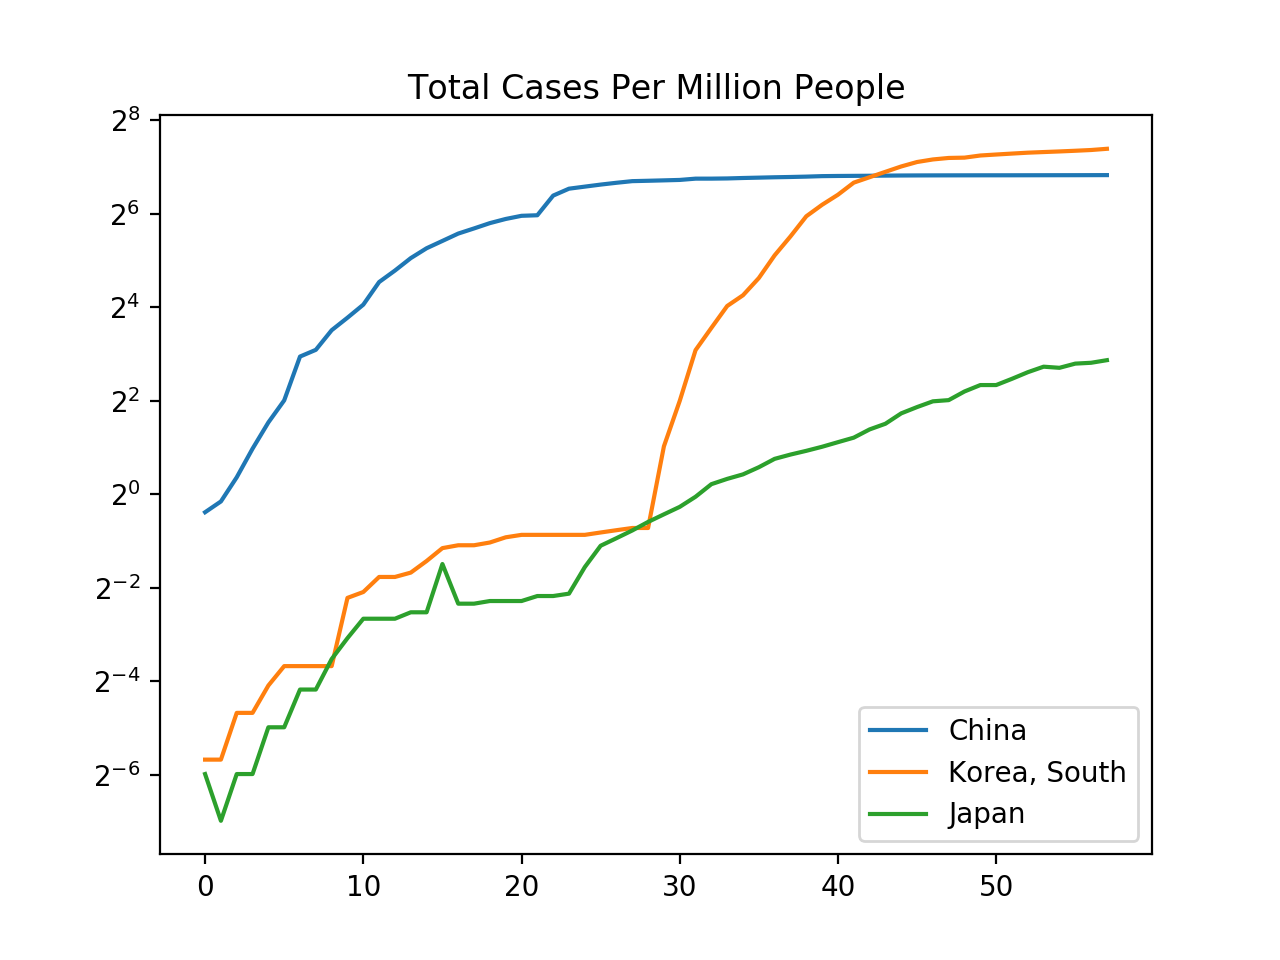
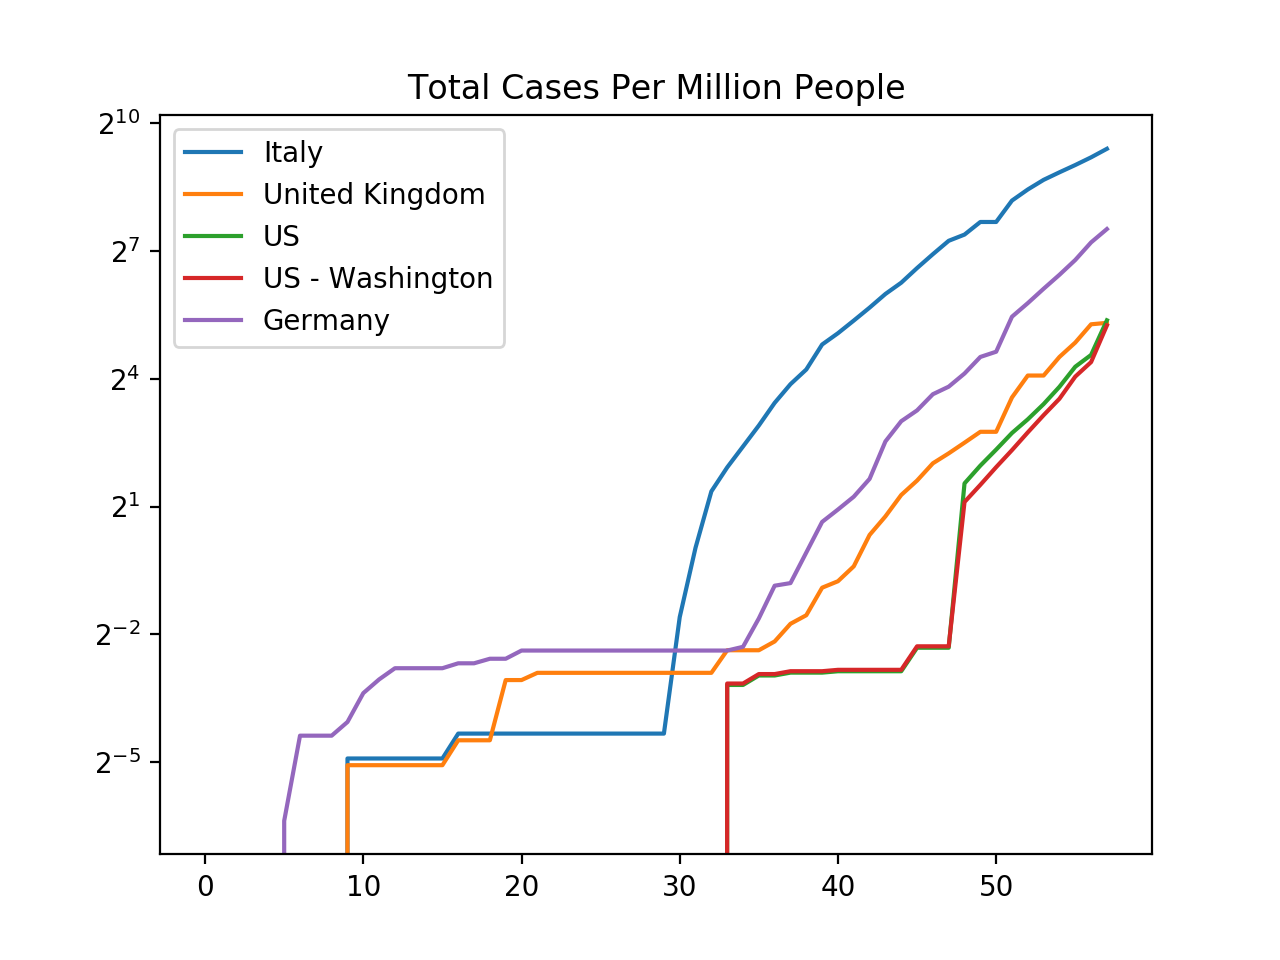
Johns Hopkins publishes the number of confirmed cases, recovered cases, and deaths by each country on each day as a CSV on GitHub.
Probably the most remarkable thing this shows is the dichotomy between how Asian and Western countries are handling the situation. In Asia, strong measures are being taken and the number of official cases are growing much more slowly than in the West (and even shrinking in China).
Among the four Western countries I checked, the official number of cases has averaged between 19% and 32% daily growth in the past five days.
Update: March 21st
In the past week, the death rate has now averaged 28% growth. This is significantly higher than the 18% predicted from the non-China growth rates, and suggests my model was optimistic regarding the total number of caes by a factor of about 5.
Meanwhile, deaths have grown to 345 and more people are suggesting the fatality rate will probably end up being 1% or less. I'll keep using the 1% number, but the model is easy to scale otherwise.
Given these numbers, I estimate 2.0 million Americans are infected - that's 73 times the official count.
By that metric, about 1% of people in Milwaukee, Madison, and Fond du Lac have the virus. In Waukesha, the rate is ~3x lower. In Santa Clara, my model predicts 1.3% of the population is infected.
Plugging this into my naive forward-looking model (which assumes no policy changes) suggests new cases will peak in 22 days, with deaths peaking about 3 weeks later (around April 4th). By the end of this, my model predicts roughly 90% of people will have been infected.
On a personal note, I'm interested in when Google will end its recommended work-from-home policy. In mid-April, I expect the number of daily new cases to equal the number of daily new cases when Google started recommending work-from-home, so (in principle) the policy will be ended then.
However, I mostly expect that the recommendation will stay in place until the deaths fall back down to the same levels, which adds 6 weeks to the estimate, pushing the date to late May.
But who really knows. Maybe Google will be more "rational" than I expect. On the other hand, I doubt the Bay Area politicians will.
But probably the biggest unknown is how effective we are at reducing $R_0$. For instance, if we reduce it from 2.39 to 1.6, I expect it to take until mid June 20th for daily new cases to match what they were when Google started recommending work-from-home, which suggests we won't be back in office until maybe early July.
Update: May 19th: Mortality Estimate
A redditor did some easy-to-follow analysis on a study in Spain that randomly tested thousands of people. They found ~5% had COVID antibodies.
They estimate (after accounting for ~23 days to die) that there arre 99 times as many cases as official deaths. However, deaths this year are higher than deaths last year and official COVID-19 deaths only accounts for ~80% of that gap in Spain. This suggests ~20% of COVID deaths aren't being counted. This and some other factors suggest the true fatality rate is about ~1.22% in Spain.
The other thing the Spanish study revealed is that risk of infection is pretty much the same for all sexes and ages, which suggests that dividing the fatality count for an age by the number of people of that age should yield a number proportional to the fatality rate at each age. This lets us estimate a fatality rate for each age and adjust the Spanish numbers for the fact that the Spanish are generally older than Americans.
Doing so suggests an overall fatality rate of ~0.92% in the US and that fatality rates change with age as
| Age Group | Fatality Rate |
| 0 - 4 | 0.00% |
| 5 - 14 | 0.00% |
| 15 - 24 | 0.01% |
| 25 - 34 | 0.05% |
| 35 - 44 | 0.10% |
| 45 - 54 | 0.35% |
| 55 - 64 | 1.31% |
| 65 - 74 | 2.96% |
| 75 - 84 | 5.71% |
| 85+ | 17.62% |
Update: Late May
20,422 people have officially died of COVID-19 in NYC so far with another ~70 per day. Based on the Spanish study, this suggests about 2.9 million people have been infected in NYC (of 6.0 million). Assuming no one else gets infected and a 7-day infectious period, this suggests R was around 1.35 post-lockdown - or about a 10% daily growth. This figure is biased downward by the assumption no one else gets infected.
Unfortunately, New York locked down very late (Mar 18th) at which point roughly a sixth of the city likely had COVID-19. If we look at official cases, the week after the lockdown (when there was minimal effect due to lag), we see a 47% daily growth rate. The week after, that slowed to 13%, which is nicely inline with our biased-downward 10% growth predicted by the eventual number of deaths.
All of which is to say, my modeling was basically spot on throughout this pandemic: I trusted official deaths, not cases, and I estimated cases were 143x official deaths while the Spanish study suggests the true ratio is 131 - a mere 9% difference.