Body Mass Index
TODO: Table A-15 2 to 20 years
Age and Marital Status
From BMI Distribution by Age Calculator for the United States:
| Age Range | 25th Percentile BMI | Median BMI | 75th Percentile BMI | Average BMI |
| 18-24 | 21.9 | 25.5 | 30.7 | 27.1 |
| 25-29 | 22.5 | 26.4 | 31.7 | 27.9 |
| 30-34 | 24.4 | 28.1 | 33.5 | 29.6 |
| 35-39 | 24.7 | 29.0 | 34.3 | 30.2 |
| 40-44 | 24.6 | 29.1 | 33.4 | 30.1 |
| 45-49 | 25.2 | 28.6 | 33.1 | 29.7 |
| 50-54 | 24.9 | 29.1 | 33.6 | 30.1 |
| 55-59 | 25.0 | 29.2 | 33.1 | 29.8 |
| 60-64 | 24.3 | 28.9 | 34.2 | 30.5 |
| 65-69 | 25.7 | 29.0 | 33.8 | 30.0 |
| 70-74 | 25.6 | 28.6 | 33.0 | 29.8 |
| 75+ | 24.1 | 27.5 | 31.2 | 28.1 |
A couple of facts:
- BMR falls by 5 calories per year-of-age Harris–Benedict equation
- BMR increases by 10 calories per kilogram Harris–Benedict equation
- The average American adult is 168.3 cm tall.
- BMI rises by about ~0.8 after marriage Jeffery. The study look at people over a 2-year interval, which means on average the 0.8 BMI increase was after one year of marriage. Extrapolating that appropriately suggests that the true long-term effect of marriage is ~1.6 BMI points (~10 pounds).
- Similar weight gain is not generally observed when going from single to dating Entry into romantic partnership is associated with obesity. There was likewise no association with cohabitation for less than a year. The association only starts when cohabitating for more than a year or married - this demonstrates pretty convincingly that the weight gain is caused by the commitment or by pregnancy.
#1 and #2 imply that, in a sedentary population with constant diet, people will gain half a kilogram per year. This with #4 imply that in this simple model equilibrium BMI will rise 0.883 per 5 years, with (from #4) another ~1.4 increase upon marriage.
Let's compare this to the actual data:
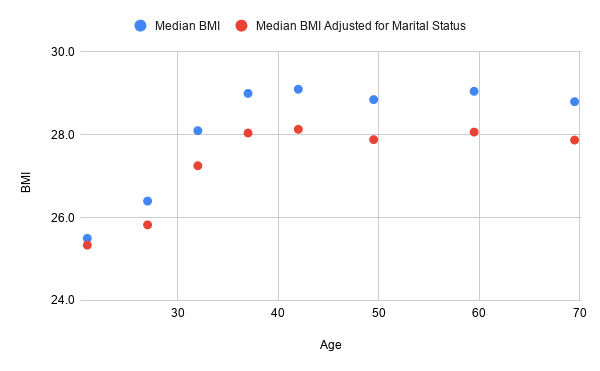
Our model model works reasonably well at predicting median BMI from an age of ~20 to an age of ~35. After this, median BMI stagnates at ~29 for reason I don't really understand.
Demographics
- IQ has no real correlation with BMI in youth, but does in adulthood Chandola. Using this data and the knowledge that the average IQ for the bottom and top thirds are 94.55 and 105.45, respectively, we can infer the implied linear relationship. The result at age 42 is that a 15 point increase in IQ is associated with a 1.2 (±0.3) reduction in BMI for men and a 2.1 (±0.4) reduction for women. When I took a look at the NLSY97 data NLSY97, I found a decent model is that IQ doesn't affect BMI around the age of 12, but that after this point 15 IQ points prevent ~0.09 BMI points per year for women and ~0.03 per year for men. This trend continues until the mid 30s, which mostly lines up with the results by Chandola.
- Relative to non-hispanic whites, other races and ethnicities have different average BMIs: +1.9 for blacks, -3.2 for Chinese, -1.2 for Filipinons, -1.9 for Indians, +1.3 for Mexicans, +1.1 for Puerto Ricans, and +0.4 for Cubans Krueger.
- The average BMIs of men and women are virtually the same (men are 0.1 higher) National Health and Nutrition Examination Survey.
Modeling
You can derive BMI for ~8000 people from their teens to their 30s using the NLSY97 dataset NLSY97. I tried fitting a Markov model to the data that accounted for measurement error and it suggests that measurement error is around 0.23 standard deviations. Given the standard deviation of BMI is around 6 (but grows with age) this suggests a measurement error standard deviation of ~9 pounds.
The measurement error from a clinical weighing is probably ~3 pounds based on normal weight fluctuations. This suggests that if the Markov model is accurate, nearly all of the measurement error (~8.5 pounds) would have to come from people misreporting.
This doesn't seem implausible.
Conversely, if you think measurement error is less than this ~9 pounds, the dataset implies that BMI tends to regress to older values. That is if your BMI is higher than its historic average (adjusted for age), it will be more likely to fall than rise - and vice versa.
Effect on Earnings
Longitudinal studies frequently find an association between BMI and income, but is it causal? That is, are people discriminated against based on their BMI?
The answer is probably no, at least for men: once you control for cognitive skills, noncognitive skills, sibling fixed effects, and some other variables, the association disappears (see Model H from Table 2) Lundborg. That being said, the 95% confidence intervals can only rule out effect sizes larger than a 9% penalty for obese men and a penalty of 9% for overweight men. Still, the point estimates are 3x smaller than the naive estimates, and we still haven't accounted for roughly half of the genes that differ between siblings.
It's unclear whether this will reproduce for women.
Even if the result does reproduce for women, it doesn't imply that BMI has no effect on one'e standard of living: it is an important determinant of physical attractiveness.
Ample evidence suggests there is assortative mating by which low-BMI and high-earning individuals are more likely to mate. First, this is suggested from observing that women find high-earning men attractive and men find low-BMI women attractive (the reverse is also true for both, but to a lesser degree).
Second, this is consistent with the fact that sibling fixed effects reduce the correlation between BMI and income by roughly half Lundborg.
Third, BMI barely predicts income for never-married women, but strongly does for married women's households Hruschka. The association between a wife's BMI and the household's income is much higher than the association between a husband's BMI and the household's income Abrevaya.